


This post contains sponsored advertising content. This content is for informational purposes only and not intended to be investing advice.
(Monday Market Open) Equity index futures are pointing to a much lower open as the S&P 500 futures are finally breaking below March lows after falling 1.9% before the open and trading below the 4,100 level. Once again, the downward pressure appears to be coming from tech stocks because Nasdaq futures were down 2.36% before the opening bell.
Potential Market Movers
If the stock market follows the futures market, the major indexes will be working on their sixth straight down week. The Cboe Market Volatility Index (VIX) had moved higher, settling just short of 34, as the 10-year Treasury yield (TNX) touched 3.2% earlier this morning in premarket action. With the sensitivity to interest rates, the rise in the 10-year yield is putting pressure on the tech-heavy Nasdaq futures.
Rising yields appear to have investors reducing other risk assets like cryptocurrencies which fell over the weekend and continued falling this morning. Bitcoin BTC/USD was down 4.6% and trading below $33,000 as it approaches 2021 lows. The crypto sell-off was broad with Ethereum ETH/USD dropping 4.75%, Cardano ADA/USD falling 8.4%, and Polkadot DOT/USD losing 6.7%.
Overseas markets were also falling. Starting in Asian, Japan’s Nikkei dropped 2.5%. China’s Shanghai Composite traded 0.1% higher despite Bloomberg reporting that China’s premier warned that the Chinese labor market was “complicated and grave” due to COVID-19 lockdowns. In Europe, the Stoxx Europe 600 fell 2.1% with similar losses in the Germany’s Dax, United Kingdom’s FTSE 100, and France’s CAC 40. The Eurozone reported that investor confidence fell more than expected in April.
Among earnings announcements making news this morning:
- Duke Energy DUK missed earnings estimates despite beating on revenue, causing the stock to fall 0.3% in premarket trading. DUK reaffirmed its fiscal 2022 earnings guidance.
- Tyson Foods TSN rose 0.2% in premarket trading after reporting better-than-expected earnings and revenue and offering forward earnings guidance in line with estimates.
- BioNTech BNTX also beat on top- and bottom-line numbers as their vaccine sales tripled in the first quarter. However, the company forecast a sales decline for 2022.
Judging by the premarket action investors appear to be moving into cash with stocks falling, yields rising, and futures like oil and gold also trading 2.5% and 1.3% respectively. Also, foreign investors appear to still be moving into the U.S. dollar as the global outlook deteriorates.
Reviewing the Market Minutes
The bulls hoped stocks would bounce back on Friday, but they didn’t get any help from a mixed Employment Situation Report. The report revealed that nonfarm payrolls added 428,000 new jobs last month, well above the forecasted 385,000, but lower than the March’s 424,000. However, most of the jobs were added in lower-paying positions in the services sector. There was more negative news with the participation rate falling from 64.4% to 62.2% due to people leaving the workforce. Additionally, the unemployment rate rose from 3.5% to 3.6%.
Stocks couldn’t seem to find upward traction as investors appeared to still be reeling from Thursday’s plunge. The Nasdaq Composite ($COMP) remains the center of the story by falling another 1.4% for a two-day loss of 6.4%. The Nasdaq has fallen down to highs it set back towards the end of 2020, which could provide some support to the index now down nearly 25% from its all-time high. The Russell 2000 (RUT) also slid 1.69%, approaching 2018 levels and down 25% from its all-time high as well.
The S&P 500 (SPX) and the Dow Jones Industrial Average ($DJI) held up a little better, falling just 0.47% and 0.30% respectively. The S&P is about 14% off its all-time high while the Dow is down a little less than 11%. These two indexes are also hanging around their March lows which could be a good sign for the broader market.
Once again, rising yields appeared to be a drag on stocks as the 10-year Treasury yield (TNX) rose 57 basis points to 3.123%. The 10-year hasn’t seen this level since 2018.
The energy sector was the top-performing group on Friday followed by utilities and consumer staples. The Energy Select Sector Index rose 2.86%, the Utilities Select Sector Index gained 0.80%, and the Consumer Staples Select Sector Index eked out a positive return of 0.11% just before the close. All other sectors were in the red.
Energy was also the top performer for the week too, rallying more than 9%. Despite the tremendous volatility last week, the majority of sectors ended near even for the week with the exception of three. The Consumer Discretionary Select Sector Index and Consumer Staples Select Sector Index were down about 1.5% each and the Real Estate Select Sector Index fell about 3.75%.
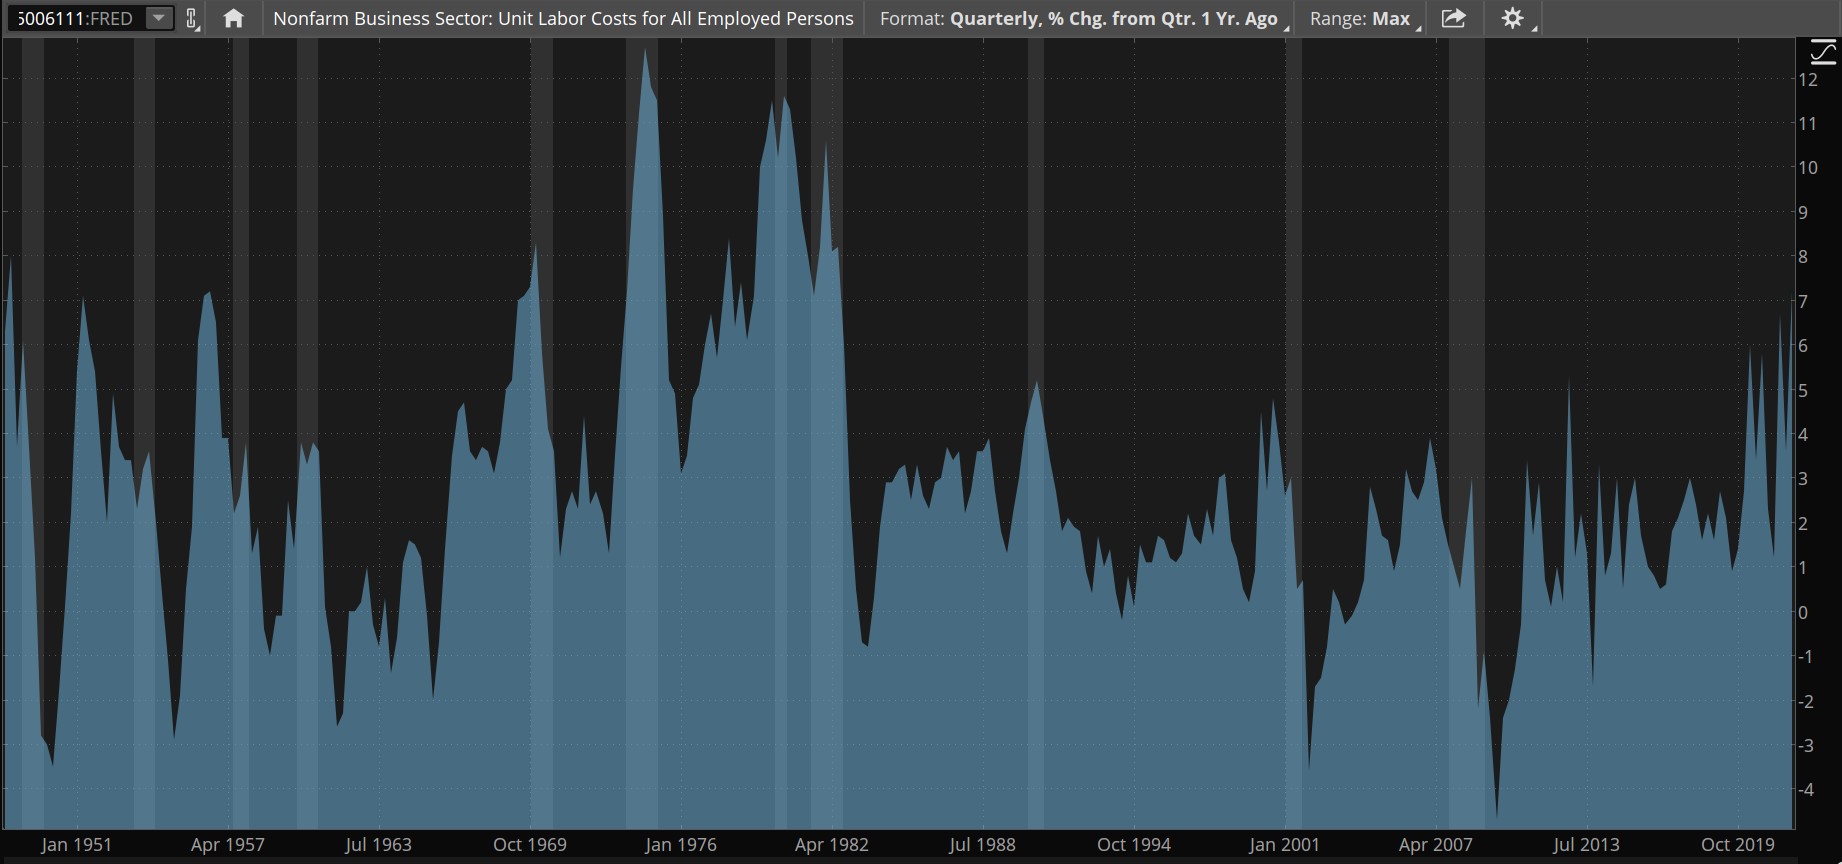
CHART OF THE DAY: COST OF LABOR. Increases in the government’s nonfarm business sector/ unit labor costs data (blue) often precedes a recession (gray columns). FRED® is a registered trademark of the Federal Reserve Bank of St. Louis. The Federal Reserve Bank of St. Louis does not sponsor or endorse and is not affiliated with TD Ameritrade. Data Sources: ICE, S&P Dow Jones Indices. Chart source: The thinkorswim® platform. For illustrative purposes only. Past performance does not guarantee future results.
Three Things to Watch
Troubling Contradiction: Friday’s Employment Situation Reports found that average hourly earnings were up 0.3% in March. In the last twelve months, earnings have risen 5.5%. While this is great news for workers, it’s one of the metrics that Fed members pay close attention to because the rising cost of labor cuts into corporate profits and can eventually lead to cost-cutting measures like layoffs. Additionally, higher pay leads to higher demand for goods and services which can also mean rising inflation. So, while we’re all happy that workers are making more money, it can be double-edged sword.
More to Come? In a note to clients from BofA Securities this week, strategists warned they don’t think the stock market has reached its lows or that Treasury yields have hit their highs. They noted that every major asset class experienced major outflows the week prior to the Fed meeting and that real estate investment trusts, or REITs, set a record of $2.2 billion in money leaving the sector. Chief investment strategist Michael Hartnett said that investors have been suffering from “inflation shock,” are now starting to suffer from “rates shock,” and will soon be faced with “recession shock.”
BofA wasn’t the only firm this week that warned of a market downturn. Deutsche Bank DB economist Matthew Luzzetti said the firm doesn’t think the Fed will manage a “soft landing” due to high inflation and monetary tightening that could eventually lead to a recession.
These are the latest in a growing list of analysts expressing recession concerns. Other recent bearish comments came from Moody’s Analytics, now seeing a 1 in 3 chance of recession, Goldman Sachs GS with a 35% probability of recession, and JPMorgan Chase JPM CEO Jamie Dimon mentioning in his annual shareholders’ letter that conditions “could easily get worse.”
Techno Retro: When markets start to break down and economic data misses forecasts, then investors start to question the fundamentals of the economy and companies. As data becomes less trustworthy, fundamental pricing models start to falter because assumptions keep changing. At these times, investors often tend to turn to stock charts as a way of deciphering where stocks might land.
Technical analysis is the term used to describe the examination of stock charts. Personally, I’m not much of technician, but I know a few and I can tell you that charts are used in various ways. Some rely heavily on charts that go to great lengths to create and test trading systems. Others use charts as part of a broader analysis that could include economic, fundamental, and even ESG information. And, then there are those who don’t use charts at all.
A problem with charts is that there are many ways investors may interpret them, which can make them highly subjective. This can lead to frustration if you’re new to technical analysis, so be patient and take some time to educate yourself so you can understand what people are talking about on the financial news. And remember that any forecasting tool can still get you caught in a storm.
Notable Calendar Items
May 10: Earnings from Occidental OXY, Suncor Energy SU, and Sysco SYY
May 11: Consumer Price Index (CPI) and earnings from Toyota TM, Walt Disney DIS, and JD.com JD
May 12: Producer Price Index (PPI) and earnings from Brookfield BAM
May 13: Michigan Consumer Sentiment and earnings from Honda HMC
May 16: Earnings from Take-Two TTWO and James Hardie Industries JHX
TD Ameritrade® commentary for educational purposes only. Member SIPC.
Image sourced from Unsplash
This post contains sponsored advertising content. This content is for informational purposes only and not intended to be investing advice.
Edge Rankings
Price Trend
© 2025 Benzinga.com. Benzinga does not provide investment advice. All rights reserved.
Trade confidently with insights and alerts from analyst ratings, free reports and breaking news that affects the stocks you care about.

