


Monthly Summary
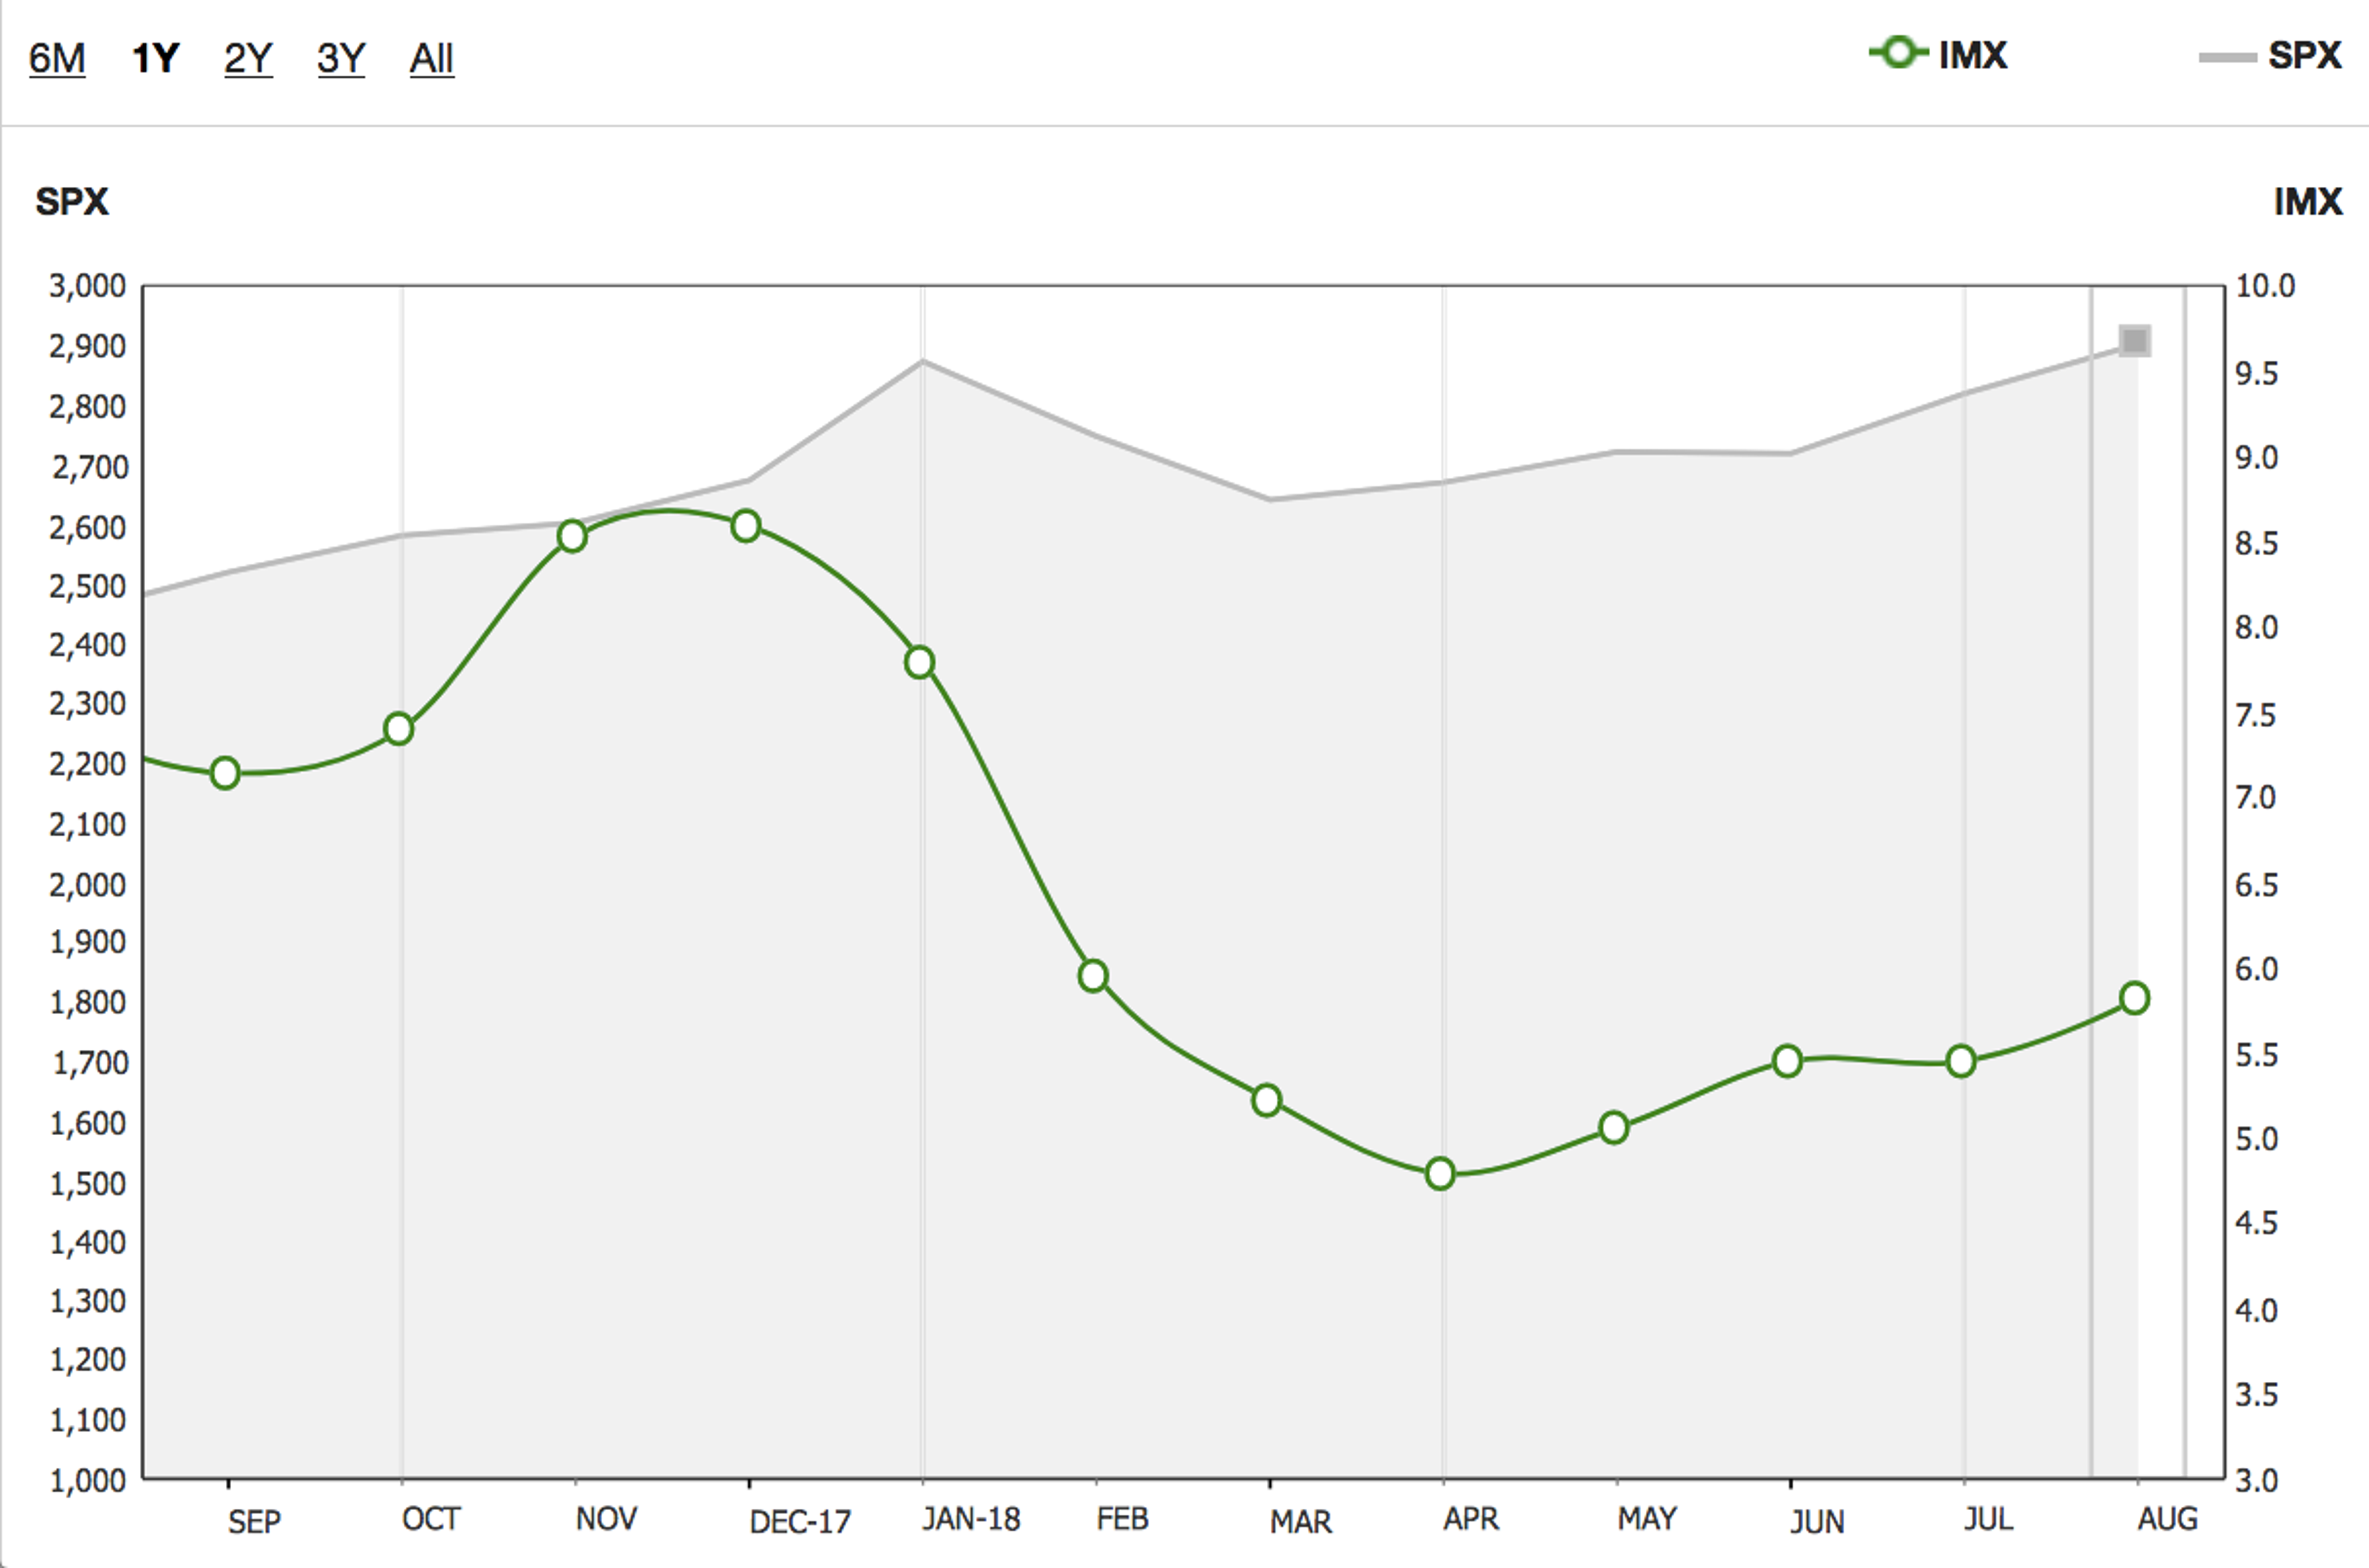
The IMX increased to the highest level since February, increasing by 6.79% to 5.82 during the August period.
TD Ameritrade clients increased their exposure to equity markets during the August period. Clients were net buyers of equities, resulting in the highest IMX score in six months. For the second period in a row, volatility among stocks in the S&P 500 was minimal, and the index failed to record a move of +/-1% during the period. Volatility of the S&P 500 as measured by the Cboe Volatility Index, or VIX, did not increase above 15 during the period.
All three major indices notched gains during the period, with the Nasdaq Composite leading the way with a 4.8% gain. The S&P 500 and Dow Jones Industrial Average were also up in excess of 2%. The Nasdaq and S&P 500 both posted all-time highs during the period, with the S&P 500 recording the longest bull market on record during the period. The stretch has lasted over 3,450 days, surpassing the previous record that stretched from late 1990 to early 2000. Market gains in August followed strong consumer strength, with retail sales in July up 6.4% from the previous year as consumers benefitted from a strong economy and tax cuts. As the economy has gained strength, the release of Federal Reserve minutes revealed Fed officials believe another rate increase during the September meeting will be appropriate.
Trading
TD Ameritrade clients were net buyers during the August period, taking on additional exposure to equities. Facebook, Inc. FB, which reached an all-time high near the end of the previous period before falling over 18% after poor earnings and posting the biggest market cap decrease in the history of the stock market, was net bought. Amazon.com, Inc. AMZN reached $2,000 for the first time ever during the period and received multiple analyst upgrades, and was a net buy. Dividend payers Ford Motor Company F and AT&T Inc. T were both net bought for the second month in a row. (F) canceled plans to import cars from China following tariff concerns, while (T) announced multiple investments across the country to increase wireless and wired networks. Advanced Micro Devices, Inc. AMD, which reached a 12-year high during the period and has more than doubled over the past 4 months, was also a net buy.
Additional popular names bought include Alibaba Group Holding, Ltd. BABA and Microsoft Corporation MSFT.
Despite being net buyers, TD Ameritrade clients appeared to take profits in some names during the period. Technology companies Qualcomm Inc. QCOM and Cisco Systems, Inc. CSCO were both net sold after reaching 52-week highs during the period. Pfizer Inc. PFE which beat on earnings during the period and reached a multi-year high, was also net sold. Tesla Inc. TSLA made headlines after company CEO Elon Musk issued a tweet saying he was contemplating taking the company private, followed by a subsequent SEC investigation of that tweet, and was net sold. Financial heavyweights Bank of America Corp. BAC and Wells Fargo & Co. WFC were both net sold after each stock trended higher over the past couple of months on the back of interest rate increases.
Additional names sold include Verizon Communications Inc. VZ, Energy Transfer Partners ETP, and Chipotle Mexican Grill, Inc. CMG.
Inclusion of specific security names in this commentary does not constitute a recommendation from TD Ameritrade to buy, sell, or hold.
Historical Overview
TD Ameritrade's Investor Movement Index (IMX) has generally correlated with the S&P 500 as clients react to equity price movements, but the index has gone through uncorrelated periods. Beginning in January 2010, when TD Ameritrade started tracking the IMX, the index rose with equity markets until April 2010, when it peaked at 5.40. In May 2010 investors experienced the "Flash Crash" and the IMX began a sharp downward trend. The IMX didn't reach 5.00 again until the S&P 500 was well above April 2010 levels. The index eventually peaked at 5.56 in June 2011. This peak was immediately followed by a plunge in equity markets, and in the IMX, as the media was dominated by the U.S. debt ceiling debate, S&P downgrade of U.S. debt, and European debt concerns. The S&P 500 began to recover in the fall of 2011, but the IMX continued to decline until it reached a new low at the time in January 2012. As the S&P 500 began to sustain an upward trend in early 2012, the IMX started to rise. In 2013, as economic conditions improved and the S&P 500 climbed to record levels, the IMX rose to the high end of its historical range, finishing 2013 at 5.62, and continued to rise in 2014 amid geopolitical tensions related to Ukraine and the Middle East, until seeing slight declines in October and November. By the middle of 2015 the IMX had seen increases, as equity market volatility had reduced to near historical levels while the market continued its upward trend. As 2015 ended its third quarter, volatility had returned to markets, as global economic concerns and speculation around the timing and trajectory of Federal Reserve rate increases seemed to rattle overall equity markets. This uncertainty continued to play a role in the equity markets through the fourth quarter of 2015 and into early 2016. The volatility accompanying this uncertainty abated in the second quarter of 2016 and remained low until late in the third quarter. Just as it had in 2015, the IMX saw increases mid-year during the period of lower volatility. The IMX continued to climb into the fourth quarter reaching 5.83 in October 2016, its highest point in two years. A brief spike in volatility during November, timed around the U.S. presidential election, coincided with a slight pull back in the IMX, which then ended 2016 at the high end of its historical range. The IMX started 2017 with an upward trend and reaching an all-time high in March, before pausing in April as lower volatility lead to a decrease in the IMX. The momentum resumed in May, with the IMX breaching 7.0 for the first time ever in July of 2017. The IMX took another brief pause in September, before following markets higher and breaching 8.0 for the first time ever in November and ending 2017 at an all-time high. Volatility returned to the markets in early 2018, and the IMX decreased for three consecutive months to start the year.
Information from TDA is not intended to be investment advice or construed as a recommendation or endorsement of any particular investment or investment strategy, and is for illustrative purposes only. Be sure to understand all risks involved with each strategy, including commission costs, before attempting to place any trade.
Edge Rankings
Price Trend
© 2025 Benzinga.com. Benzinga does not provide investment advice. All rights reserved.
Trade confidently with insights and alerts from analyst ratings, free reports and breaking news that affects the stocks you care about.

