


The fatigue we all might feel as this jam-packed week winds down appears to be affecting major indices Friday. They’re under pressure early despite Amazon’s AMZN impressive earnings yesterday, with signs of a bit of slowness in China’s economy dragging things lower.
China’s services sector slowed this month, data showed, and manufacturing remains barely in expansionary mode. We still have weakness out of Europe, and China was expected to be coming along. Now that there’s a little weakening in China, that’s something rattling the markets a little bit. Another thing troubling some investors is the fact that more fiscal stimulus is coming in when many economists aren’t really sure it’s needed, which drives concerns about inflation.
Speaking of which, core personal consumption expenditure (PCE) prices came in at 0.4% for March, a little higher than analysts had expected and higher than the previous reading of 0.1%. Markets are worried that we really haven’t gotten to the full impact of recovery and how that surge in demand is going to affect prices. There’s still lots of recovery to go and PCE prices are already up 2.3% year over year. The market’s a little concerned because companies are reporting supply shortages as it is and we aren’t even in full reopening status.


April On Pace For Firm Wall Street Gain As Earnings Roll On
There’s still a lot of earnings ahead, and next week brings the April payrolls report. But for headline excitement, no week in the quarter can match the one we just had. Four of the five “FAANG” companies reported, the Fed held its meeting, and investors got a first look at Q1 gross domestic product.
The S&P 500 Index (SPX) set a new record high yesterday, but it looks like some profit-taking might be in the mix this morning. That’s not too surprising considering this is the last day of the month and the SPX is up 6% so far in April.
After stumbling in January, the SPX is on pace for its third straight month of gains, up about 12.1% year-to-date. More than 80% of S&P 500 companies reporting so far have beaten Wall Street’s consensus earnings estimates, and generally they’ve painted optimistic pictures about the coming months as the economy reopens. That said, the market hasn’t really found a lot of traction since earnings season began, hinting that it could be at levels where buyers are becoming a bit scarce.
Energy comes into focus today with earnings from a couple big players, Exxon Mobil XOM and Chevron CVX. They report as the price of gasoline approaches $3 a gallon across the U.S., up more than $1 from a year ago. Investors may want to hear from executives about media reports of possible gasoline shortages in parts of the country due in part to logjams in the supply chain. One challenge that recently cropped up is finding qualified fuel truck drivers to transport the product to gas stations.
Crude slipped again this morning, falling back toward $63 a barrel on apparent demand worries. There does seem to be major resistance near $65. The front-month futures contract knocked against that again yesterday and ran into sellers.
The same thing might be happening in the bond market, where 10-year yields can’t make much progress above 1.65%. A move above that earlier this week didn’t find much traction, and we’re back near 1.64% this morning. Any rally back toward 1.7% or above could grab traders’ attention after the dovish Fed meeting this week.
Another slip this morning came from Twitter TWTR, down 12% in pre-market trading after its earnings report sparked concern about subscriber growth. As we’ve seen a lot this quarter, beating Wall Street’s consensus (as TWTR) did isn’t really enough. Investors want to hear positive stories about the future. Also, a lot of companies approached earnings season riding mega-rallies over the last year. TWTR shares were up 127% over the 52 weeks heading into its report. That often means you’ll see selling on anything less than perfection.
On the data front, the government reported big gains in March personal income and spending, not too surprising considering the stimulus checks people received that month.
Amazon Latest FAANG To Prosper In Q1
It’s going to be hard to top the earnings hat trick from FAANG members Apple AAPL, Facebook FB, and now AMZN over the last two days. The SPX scored new record highs Thursday partly due to this pattern of excellent earnings, with help from healthy U.S. gross domestic product (GDP) growth of 6.4%.
AMZN didn’t break the winning streak for big Tech. Revenue of $108.5 billion was up 44% from the same quarter a year ago and easily outpaced Wall Street’s expectations, while earnings per share of $15.79 smashed analysts’ average projection for $9.54.
It didn’t hurt to see AMZN also painting a positive picture around Q2, where it sees revenue of between $110 billion and $116 billion, up 24% to 30% from a year ago. All this earnings season, the companies sounding most optimistic about the future have been the ones most rewarded by the Street, and AMZN was no exception as shares bounded up 3% in pre-market trading.
Part of AMZN’s hopes for Q2 are based on its Prime Day happening during the quarter. Remember that last year it was postponed due to Covid. Despite the delay, people bought $10.4 billion worth of goods from the company in just 48 hours on Prime Day 2020, so it’s a big deal.
More Earnings Ahead Next Week, But Data Stand Out
Looking ahead to next week, the earnings parade continues, but without necessarily as much intensity as this week when so many big-Tech names reported. Some of the sluggers to look out for include ConocoPhillips COP, Pfizer PFE, Uber UBER, PayPal PYPL, Wynn Resorts WYNN, Allstate ALL, T-Mobile TMUS, and Lyft LYFT.
A lot of those (you can probably figure out which ones) will likely be closely watched to see how they’re navigating the economic reopening and what sort of emerging consumer trends they’re noticing. We’re already one-third of the way into the new quarter, so don’t forget to check earnings calls for the latest status check from executives. It’s a great way to get some color as you look ahead to Q2 reporting season (only two and a half months away!)
There’s a bunch of data on the plate next week, too, but a couple really stand out. First is Monday’s IMS manufacturing report for April. It reached a 37-year high in March of 64.7, and there’s some debate about whether it can achieve much more traction at these levels. We’ll soon find out.
Payrolls next Friday is the one that deservedly is going to get the most attention, with some analysts this week saying April jobs growth could top one million after exceeding 900,000 in March. That’s likely to be the high end of estimates, so let’s watch where consensus heads in the days before the report. We’ll preview it in more detail next week in this space.
Keeping An Eye On Volatility
The Cboe Volatility Index (VIX) climbed late this week even as the S&P 500 Index (SPX) posted a new all-time high. VIX is above 18 this morning. When you have these two things happening at once, it often means something doesn’t match up. Either VIX has to go down, or stocks do. It’s just a matter of which one gives way to the other.
Quite often lately, a higher VIX accompanying higher stock prices has been a good clue that equities may be in for some selling, though remember that the past doesn’t necessarily tell fortunes. Also, VIX did run into some resistance on Thursday after topping 18.
These are still relatively high levels, but they might seem light because everyone got used to 40 and above for much of last year. If you look out at the VIX futures complex, it’s in the mid-20’s by summer so some traders evidently don’t think the turbulence is necessarily over.
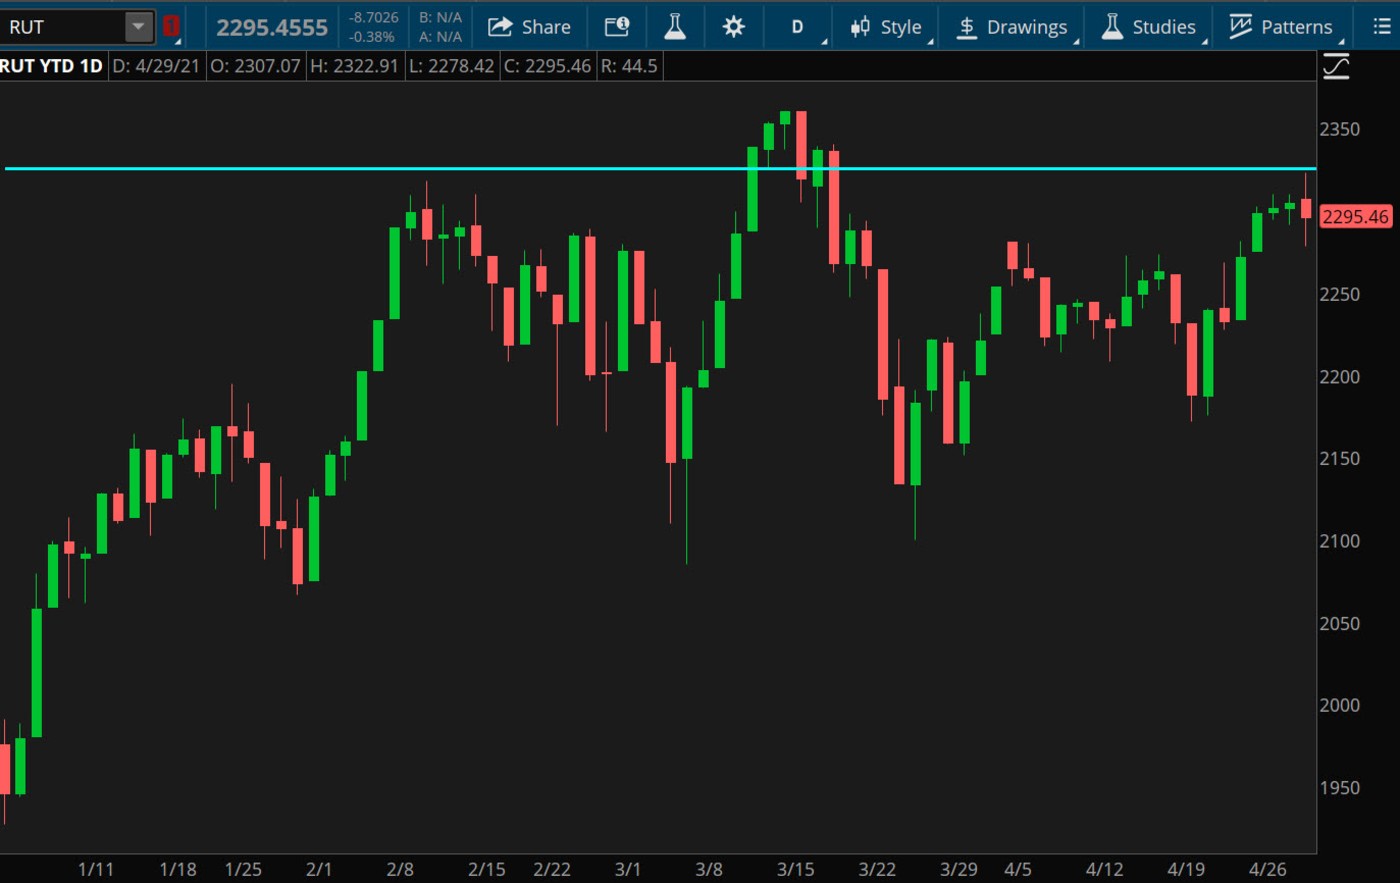
CHART OF THE DAY: CLASSIC PATTERN FOR RUT. The small-cap Russell 2000 (RUT—candlestick) looks like it’s developing a classic “head and shoulders” pattern in this year-to-date chart. Since peaking at an all-time high of 2360 in mid-March, it backtracked, then started climbing again. Now it’s back in the same 2290 area it was in back in late February. A head and shoulders pattern can occur at the top of an uptrend, or the bottom of a downtrend. Data Source: FTSE Russell. Chart source: The thinkorswim® platform. For illustrative purposes only. Past performance does not guarantee future results.
Rolling Over A RUT: Yesterday—as the market continued to digest the late stages of earnings season and the context of Fed Chair Jerome Powell’s latest comments—price action gave technical traders a little bit of everything. First, the small-cap bellwether Russell 2000 Index (RUT) finished the day in the red, after failing to climb above what chart-watchers could call a classic head-and-shoulders setup (see chart above). Many analysts see the RUT as a leading indicator for the stock market because broader macroeconomic trends often hit the more sensitive small caps more acutely and more quickly. Could recent price action in the RUT turn out to be a harbinger for the broader market?
In comparing RUT to the S&P 500 Index (SPX) and Nasdaq-100 Index (NDX), things were looking pretty ominous around midday. The indices started out at record highs, but then turned sharply lower in what was setting up to be what technical traders call a “key reversal”—a higher high than the previous day, followed by a lower close. But SPX and NDX both turned back higher by the end. Key reversal averted for the time being. Still, both indices sit well above their 50-day moving averages, and the relative strength index (RSI) recently put SPX in the “overbought” category. Perhaps now’s not a great time to see weakness in the RUT.
Comparison Shopping: The tried and true way to assess a company’s earnings is to compare them with the same quarter a year earlier. However, that’s falling out of fashion this earnings season and could be even less relevant in Q2 as companies start “lapping” the deepest trough of the 2020 Covid lockdowns. As the chief financial officer of McDonald’s MCD told CNBC on Thursday, the more appropriate comparison might be looking back to the same quarter of 2019, or else things could get skewed. Now, of course, it’s easy for MCD to say that, considering they just had a quarter where they topped pre-Covid sales. It’s a lot tougher if, for instance, you’re an airline or a casino. Those businesses had a lot more trouble adapting to the Covid crisis than a restaurant chain like MCD that could emphasize drive-through and delivery. Asking them to compare to a healthy 2019 could be seen as unfair.
Too Easy: The same “two-year tango” might also apply to some of the data we’re heading toward, especially the April consumer and producer price indices, as well as April retail sales. Comparisons to a year ago are going to almost certainly be easy, making it look like the economy is even hotter than it seems to be. The key is looking at month over month, and if you do look at year-over-year, understanding the strange circumstances. That’s one reason the Fed keeps emphasizing “transitory” inflation readings, and it might not be until late this year that investors start to get a true sense of year-over-year inflation.
TD Ameritrade® commentary for educational purposes only. Member SIPC.
Image Sourced from Pixabay
Edge Rankings
Price Trend
© 2025 Benzinga.com. Benzinga does not provide investment advice. All rights reserved.
Trade confidently with insights and alerts from analyst ratings, free reports and breaking news that affects the stocks you care about.

