


It makes sense that tonight is the start of football season because the market’s been taking a few hits.
Major indices headed lower again overnight as the mood seems to remain cautious. Treasury yields fell ahead of a series of auctions that could help us get a sense of how much demand is out there for U.S. debt.
Overseas, meanwhile, the European Central Bank kept rates unchanged but decided to dial back its emergency bond purchases, Reuters reported. The ECB has been buying 80 billion euros of debt each month, and some analysts expect that to fall by 10 billion to 20 billion euros.
While there’s no way to know what this might mean for Fed policy, central banks around the world have been known to work in sync at times. It’s kind of interesting to see European stocks trim some of their earlier losses this morning following the ECB’s move, though it’s way too early to draw any conclusions about the market reaction. One idea is that investors might see slowing bond purchases by central banks as evidence the economy is in a better place.
In the U.S., the Treasury market didn’t appear to show many reactions to the ECB move. The 10-year yield moved down a couple of basis points to near 1.33%.


Featureless Trading A Feature
The stock market these days might remind some people of that old story about the emperor’s new suit. Everyone acts like they see something there, but there really isn’t much to look at.
We’ve had three days in a row of S&P 500 Index (SPX) losses, and the Nasdaq GIDS had its win streak broken yesterday. There doesn’t seem to be any real direction now, and no real spark to the upside.
The string of losses followed last week’s disappointing U.S. jobs growth data from the government, but some analysts say the softness reflects a growing belief that the Fed could start tapering stimulus. Traditionally, the Fed has tapered when the economy does better, but much of the recent data including jobs, haven’t been too uplifting. So it’s unclear exactly what the Fed might do. Less clear than before the jobs report, arguably.
Then we saw a couple of the biggest investment banks—Goldman Sachs GS and Morgan Stanley MS—release bearish notes saying the Delta variant and slowing economic growth pose potential risks. MS thinks there could be a 10% to 15% pullback in stocks before the end of the year.
There’s no way to know if MS is right, and it’s definitely true we haven’t seen even a 5% drop all year. That makes this one of the few recent years not to experience that big a pullback, and it has a lot of analysts wringing their hands. Also, September is historically a seasonally weak month.
At the same time, indices continue to trade just below all-time highs. This means it could take a strong catalyst to encourage investors to jump in with more money.
Some Signs Of Progress
A couple of earnings reports came out over the last day, with GameStop GME shares falling pretty sharply after the company didn’t give guidance. Meanwhile, lululemon LULU shares hustled to double-digit gains in pre-market trading following its earnings release. Somebody threw a fastball in batting practice and LULU drove it to left-center field. To continue the baseball metaphor, they hit a home run and flipped the bat.
Turning to data, Friday brings the U.S. government’s August Producer Price Index. This is likely going to give us some insight as to whether Fed Chairman Jerome Powell’s “transitory” inflation theory has legs. Wall Street analysts look for a 0.6% monthly increase in PPI, according to research firm Briefing.com.
That’s still historically high, but down from 1% the month before. A figure like 0.6%, if we get it, could ease some of the inflation worries and maybe put pressure on Treasury yields. The benchmark 10-year yield fell to 1.33% on Wednesday and has struggled to move above technical resistance near 1.38%.
This morning’s weekly initial jobless claims from the U.S. government fell to 310,000, the lowest since Covid began. That was way below the 345,000 that analysts had expected, according to research firm Briefing.com.
The Cboe Volatility Index (VIX) traded just above 18 early today after scraping down near 16 late last week. It feels like there’s some defensiveness being priced into both bonds and VIX as investors fret about possible seasonal weakness in stocks. Another “horseman of fear,” the dollar, also rose Wednesday, but gold fell.
Some of the caution could be related to politics in Washington, D.C., where Treasury Secretary Janet Yellen delivered a warning about the debt ceiling this week. Failure of Congress to resolve the issue could lead to market jitters, as some people might remember from 2011 when this happened.
Retail Traders Dip Their Toes Into Market
The Investor Movement Index® (IMXSM) rose to 8.38 in August, up just slightly from a 8.34 in July. The IMX is TD Ameritrade’s proprietary, behavior-based index, aggregating Main Street investor positions and activity to measure what investors actually were doing and how they were positioned in the markets.
The reading of 8.38 is on the high side compared with historic averages, and that goes along with major indices hitting new records during the IMX reporting period. The markets had their seventh-straight winning month, which has created quite a positive environment. With economic data, the Delta variant, changing geopolitics, and inflation fears sending mixed messages, investors should remain watchful as we head into September, which has a reputation for being one of the most volatile months of the year.
It’s worth pointing out that while TD Ameritrade clients were net buyers of products overall during the August IMX period—they were net sellers of equities and net-buyers of products like fixed income that often reflect caution. Some of the popular equity names bought during the period included Apple AAPL, Ford F, Nvidia NVDA, and Microsoft MSFT.
Key stocks that got net-sold by TD Ameritrade clients in August included Tesla TSLA, Netflix NFLX, and Advanced Micro Devices AMD.
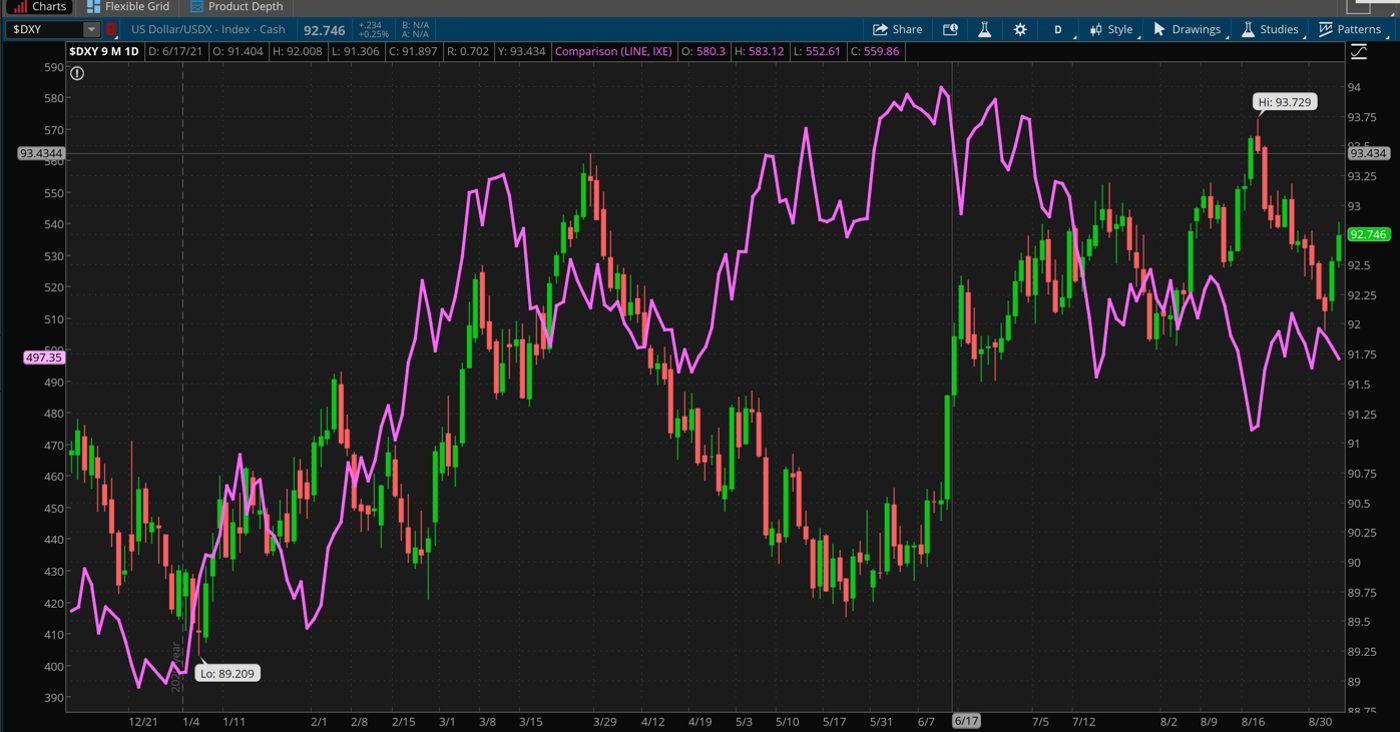
CHART OF THE DAY: TAKING A CUE. Back a few months ago, the weaker dollar ($DXY—candlestick) was one possible source of a tailwind for the Energy sector (IXE—purple line). That relationship changed as the dollar rose in late summer on thoughts of a Fed taper, but now the gap between Energy shares and the dollar has closed a bit. Data Souces: ICE, S&P Dow Jones Indices. Chart source: The thinkorswim® platform. For illustrative purposes only. Past performance does not guarantee future results.
Dollar Stays In Pocket: Back in the 1990s, the crude market was often so static that U.S. front-month futures would spend weeks in a row at a single “handle,” meaning not rising more or falling more than $1. Seems kind of crazy to think of looking back from the current era when crude prices are so volatile. But if there’s an equivalent to the “static crude” today, maybe it’s the dollar index. It’s stayed mostly around the 92 to 93 level for several weeks, kind of in the middle of a longer-term range, as investors try to balance worries about potential weakness in the U.S. economy with thoughts of the Fed possibly pulling away the punch bowl that’s put so much pressure on the greenback over the last 18 months.
That’s why it’s an odd time for the dollar and for stock sectors that tend to be more dollar-focused, such as small-caps and multinational companies. These sectors often take their direction to some extent from the dollar’s movements, because a stronger dollar can hurt multinationals by making their products more expensive overseas, and help small-cap firms that tend to have less of a foreign presence. The Energy sector is also closely tied to the dollar because crude is priced in dollars and often falls when the greenback rises (see chart above). It doesn’t look like the dollar is in any hurry to make a big move, though you never know. Until it does, those sectors could be spinning their wheels a bit.
ECB Meeting Eyed for Fed Clues: This never-ending focus on monetary policy isn’t going away just because the Fed’s Jackson Hole symposium is in the rear-view mirror. We’re less than two weeks out from the Fed’s next meeting on Sept. 21-22, and today wrapped up the European Central Bank’s (ECB) latest meeting. Though obviously, the central banks are independent, they do sometimes take cues from each other, so watch closely to see what the ECB says in its post-meeting press conference. As for the Fed, last week’s disappointing U.S. government jobs report for August almost certainly provided some “cover,” if you will, for a delayed decision on tapering stimulus.
While you never want to get into the prediction business, it could be relatively easy for Fed Chairman Jerome Powell to come out of the next meeting and say, “I told you so” about the economy not being ready yet for any sort of policy change. That said, other Fed officials continued to chomp at the bit for a taper despite the jobs data, media reports said this week. Could we be seeing signs of some fracturing at the Fed as Powell’s term approaches expiration early next year and his renomination is a growing subject of debate in D.C.? Stay tuned.
Turning Down Tesla: One interesting takeaway from the August IMX report was seeing investors tracked by the data stepping out of Tesla TSLA. Though TSLA was one of the “darlings” of the retail trade for a couple of years, it’s only up 7% so far this year, way behind Ford F and General Motors GM. A couple of things may be playing out here. Number one, when TSLA gets back above $700, it seems to bring people out as sellers a little bit more. The $700 level has been acting like a magnet on the stock.
The other thing that might be hurting TSLA in the eyes of some retail investors is the growing competition Tesla is facing in the electric vehicle space. Though it has not all been smooth sailing for emerging players such as GM,, the prospect of EV rivals getting hot on the heels of TSLA may be spurring some retail traders to check out the competition at other showrooms, so to speak.
TD Ameritrade® commentary for educational purposes only. Member SIPC.
Image by Free-Photos from Pixabay
Edge Rankings
Price Trend
© 2025 Benzinga.com. Benzinga does not provide investment advice. All rights reserved.
Trade confidently with insights and alerts from analyst ratings, free reports and breaking news that affects the stocks you care about.

