It’s dizzying to imagine the thousands of ways to invest and generate future value from your cash. In stock trading, of course, you always aim for a higher future value on your investments, and analysts do calculations and approximations of every kind to predict the real future value of investments.One of the most important concepts to master before you begin investing is earnings per share and how to calculate it.
Overview: What is Earnings Per Share?
In finance, earnings per share (also known as EPS) is a company’s profit allocated to each of the company’s shares. EPS shows you how much profit a single share of a company has generated.
Example
If the earnings per share of a company were $5 for the last year and you had 50,000 shares, you’d generate:
$5 x 50,000 = $250,000
Of course, you cannot tell if a specific amount of earnings per share is good if you don’t take the original stock price into consideration. After all, you need to purchase these shares in order to enjoy the earnings from each of them. If a share of a company costs $500, will $5 earnings per share be sufficient for a one-year period? Let’s see what happens with 50,000 shares:
$500 x 50,000 = $25,000,000 ($25 million)
Let’s summarize: You purchase 50,000 shares for $25 million and earn $250,000 for one year. Here is how much is this expressed in a percentage:
$250,000 / $25,000,000 = 0.01 or 1%
Is this a sufficient percentage? Probably not if you keep your overall risk in mind.
What Does Earnings Per Share Tell Us?
Earnings per share is among the most important indicators that show the company’s profitability and the value of the business. It tells us whether the company is doing well or not and is crucial as you analyze companies. If you want to invest in a company, use the EPS indicator, but as you saw in the previous paragraph, the EPS is not a good stand-alone indicator to determine if an investment is worthwhile or not.
In many cases, people neglect a very important component of the company’s earnings – the capital needed to generate these earnings. The source of income is the indicator that puts meaning in the EPS. Analysts inspect the complete balance sheet and income statement of a company to identify the results of its activity and the earnings for a specific period of time.
These reports tell experts if a company is likely to perform poorly or if it is one step ahead of the competition. If a company finances its activity with untracked capital, this will jeopardize earnings from this capital and the earnings will not make any sense.
One-year earnings per share will not be able to tell you if a company is competitive. Instead, you’ll need to look at a longer period and look for a tendency.
To understand how tendencies work, here is some fictitious sixteen-year data:

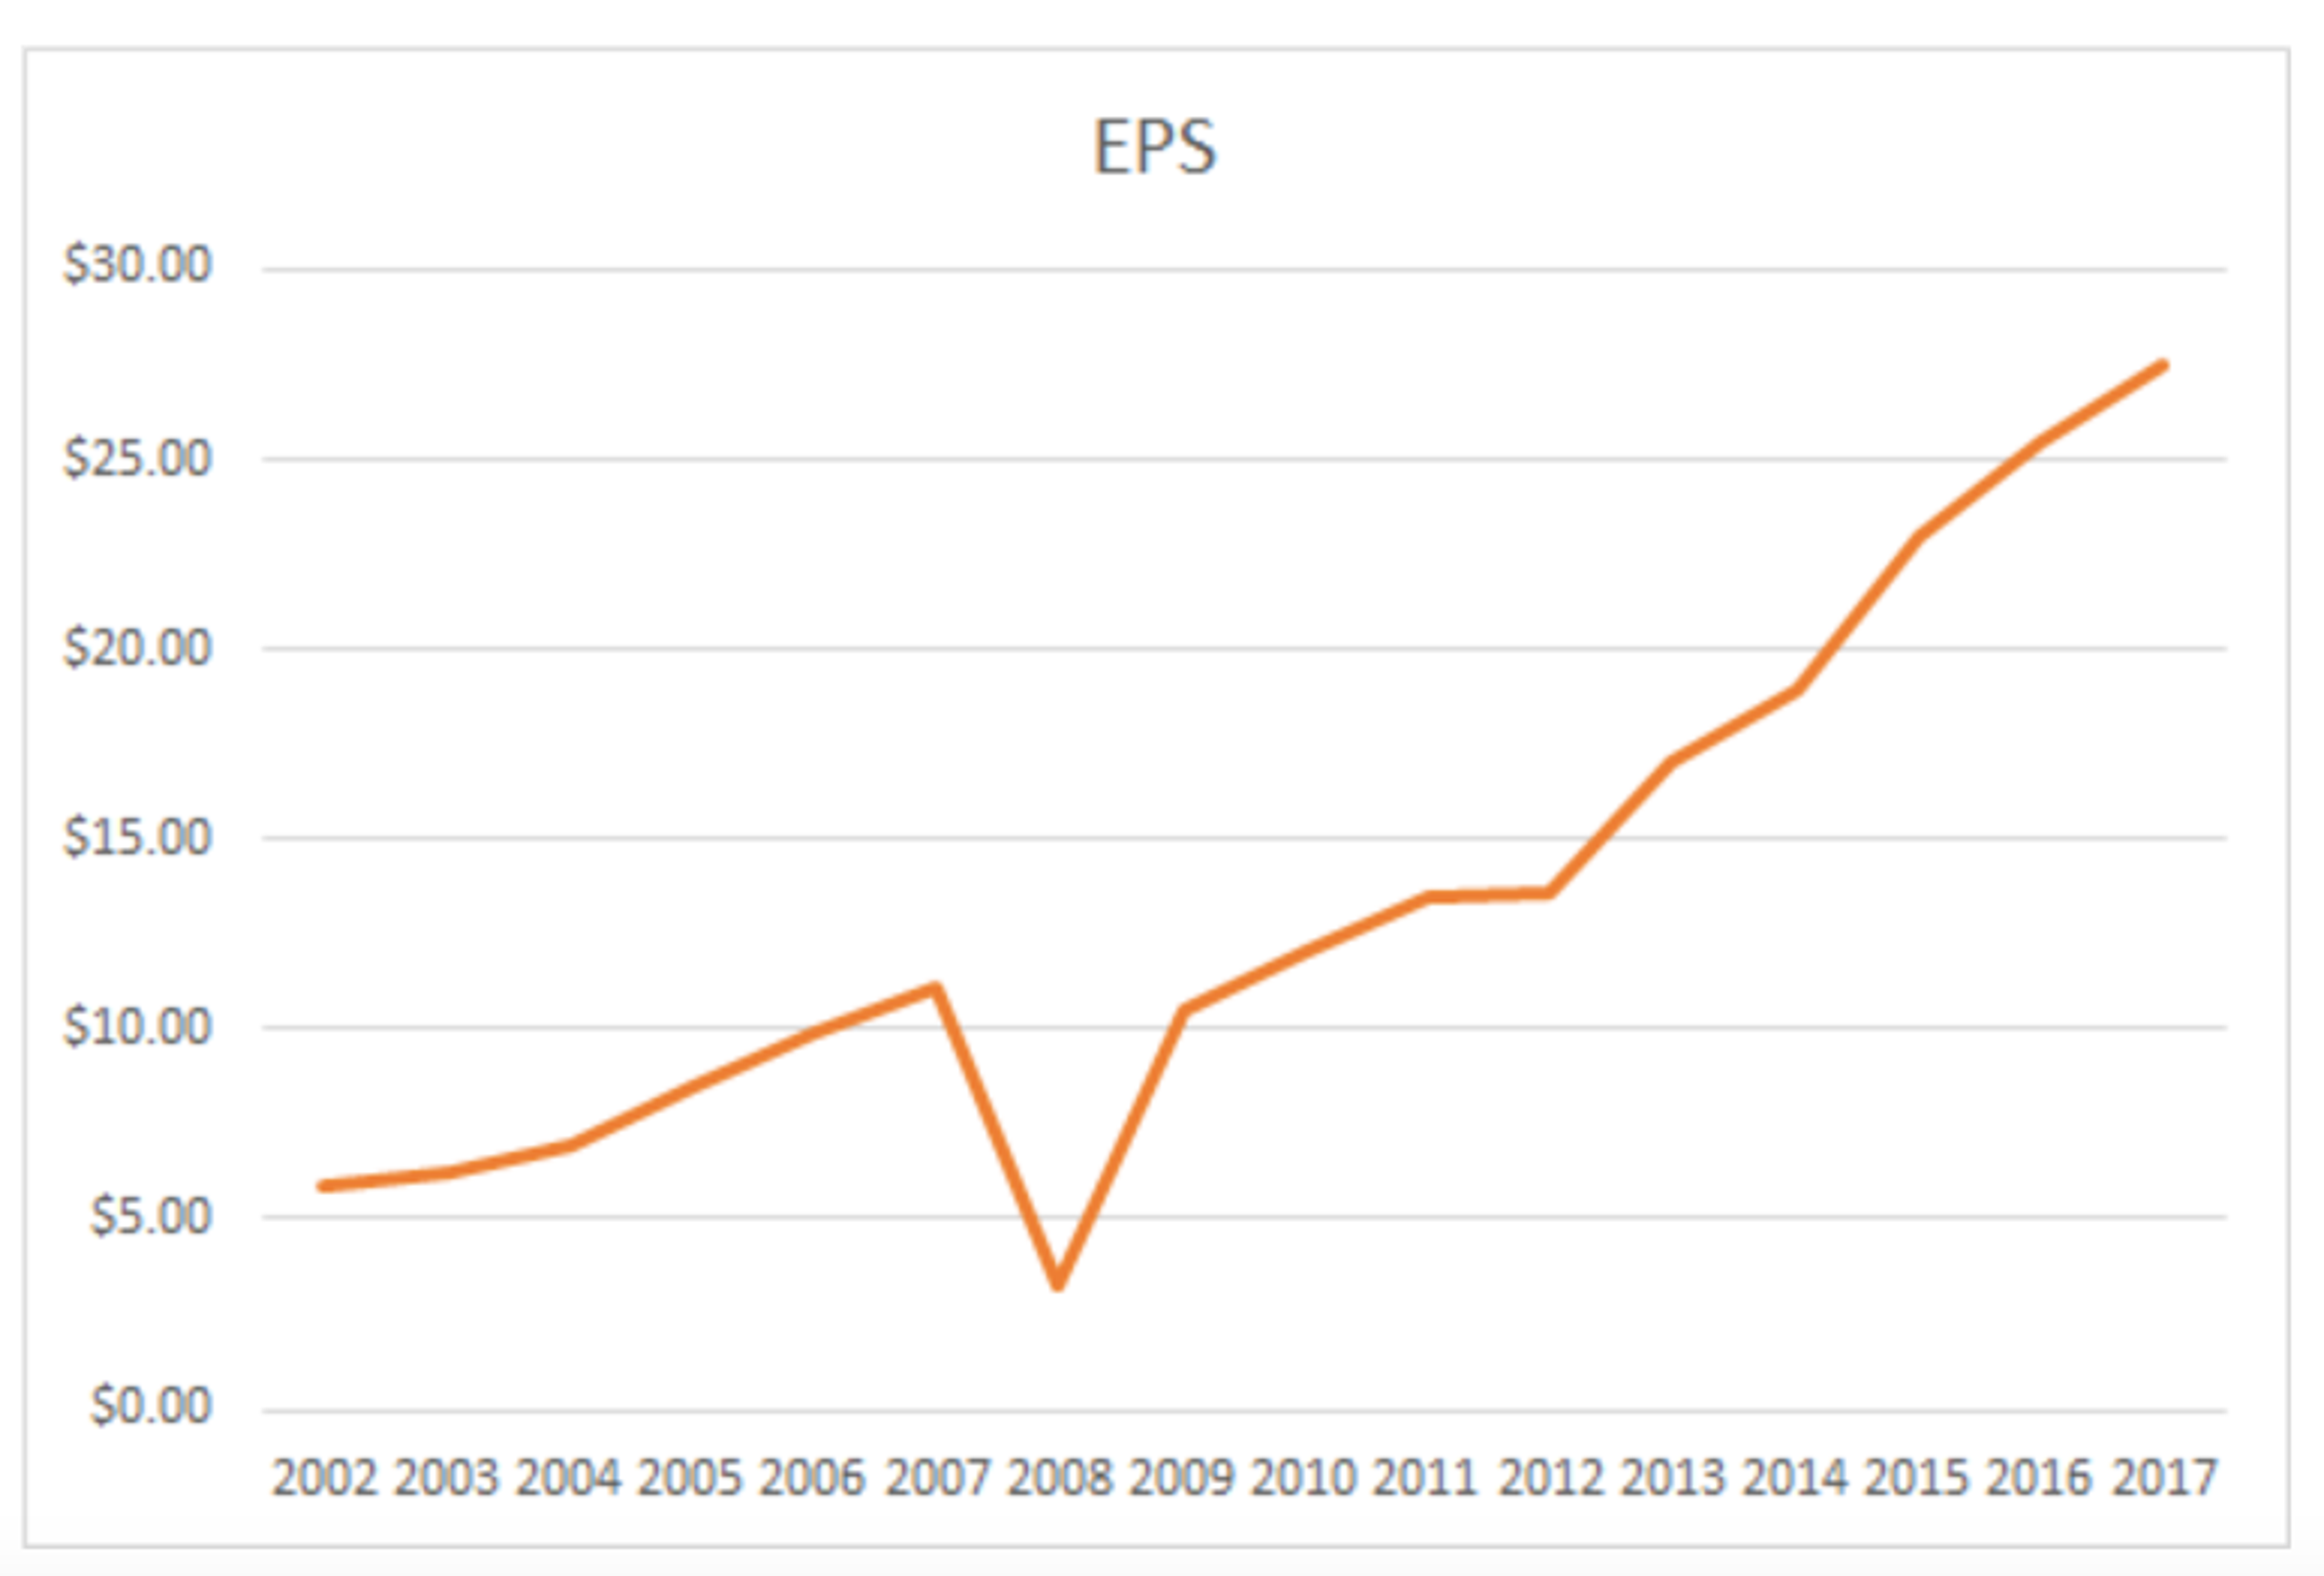
From 2002 to 2017, a clear trend emerges as the company’s EPS increases. There’s a gap in the chart due to the world economic crisis, which is common for a company chart that includes the year 2008. Overall, a tendency of growing EPS means that the company may be competitive enough to grow and expand its market share.
1. Correlates with Stock Price
There’s also a correlation with stock prices.

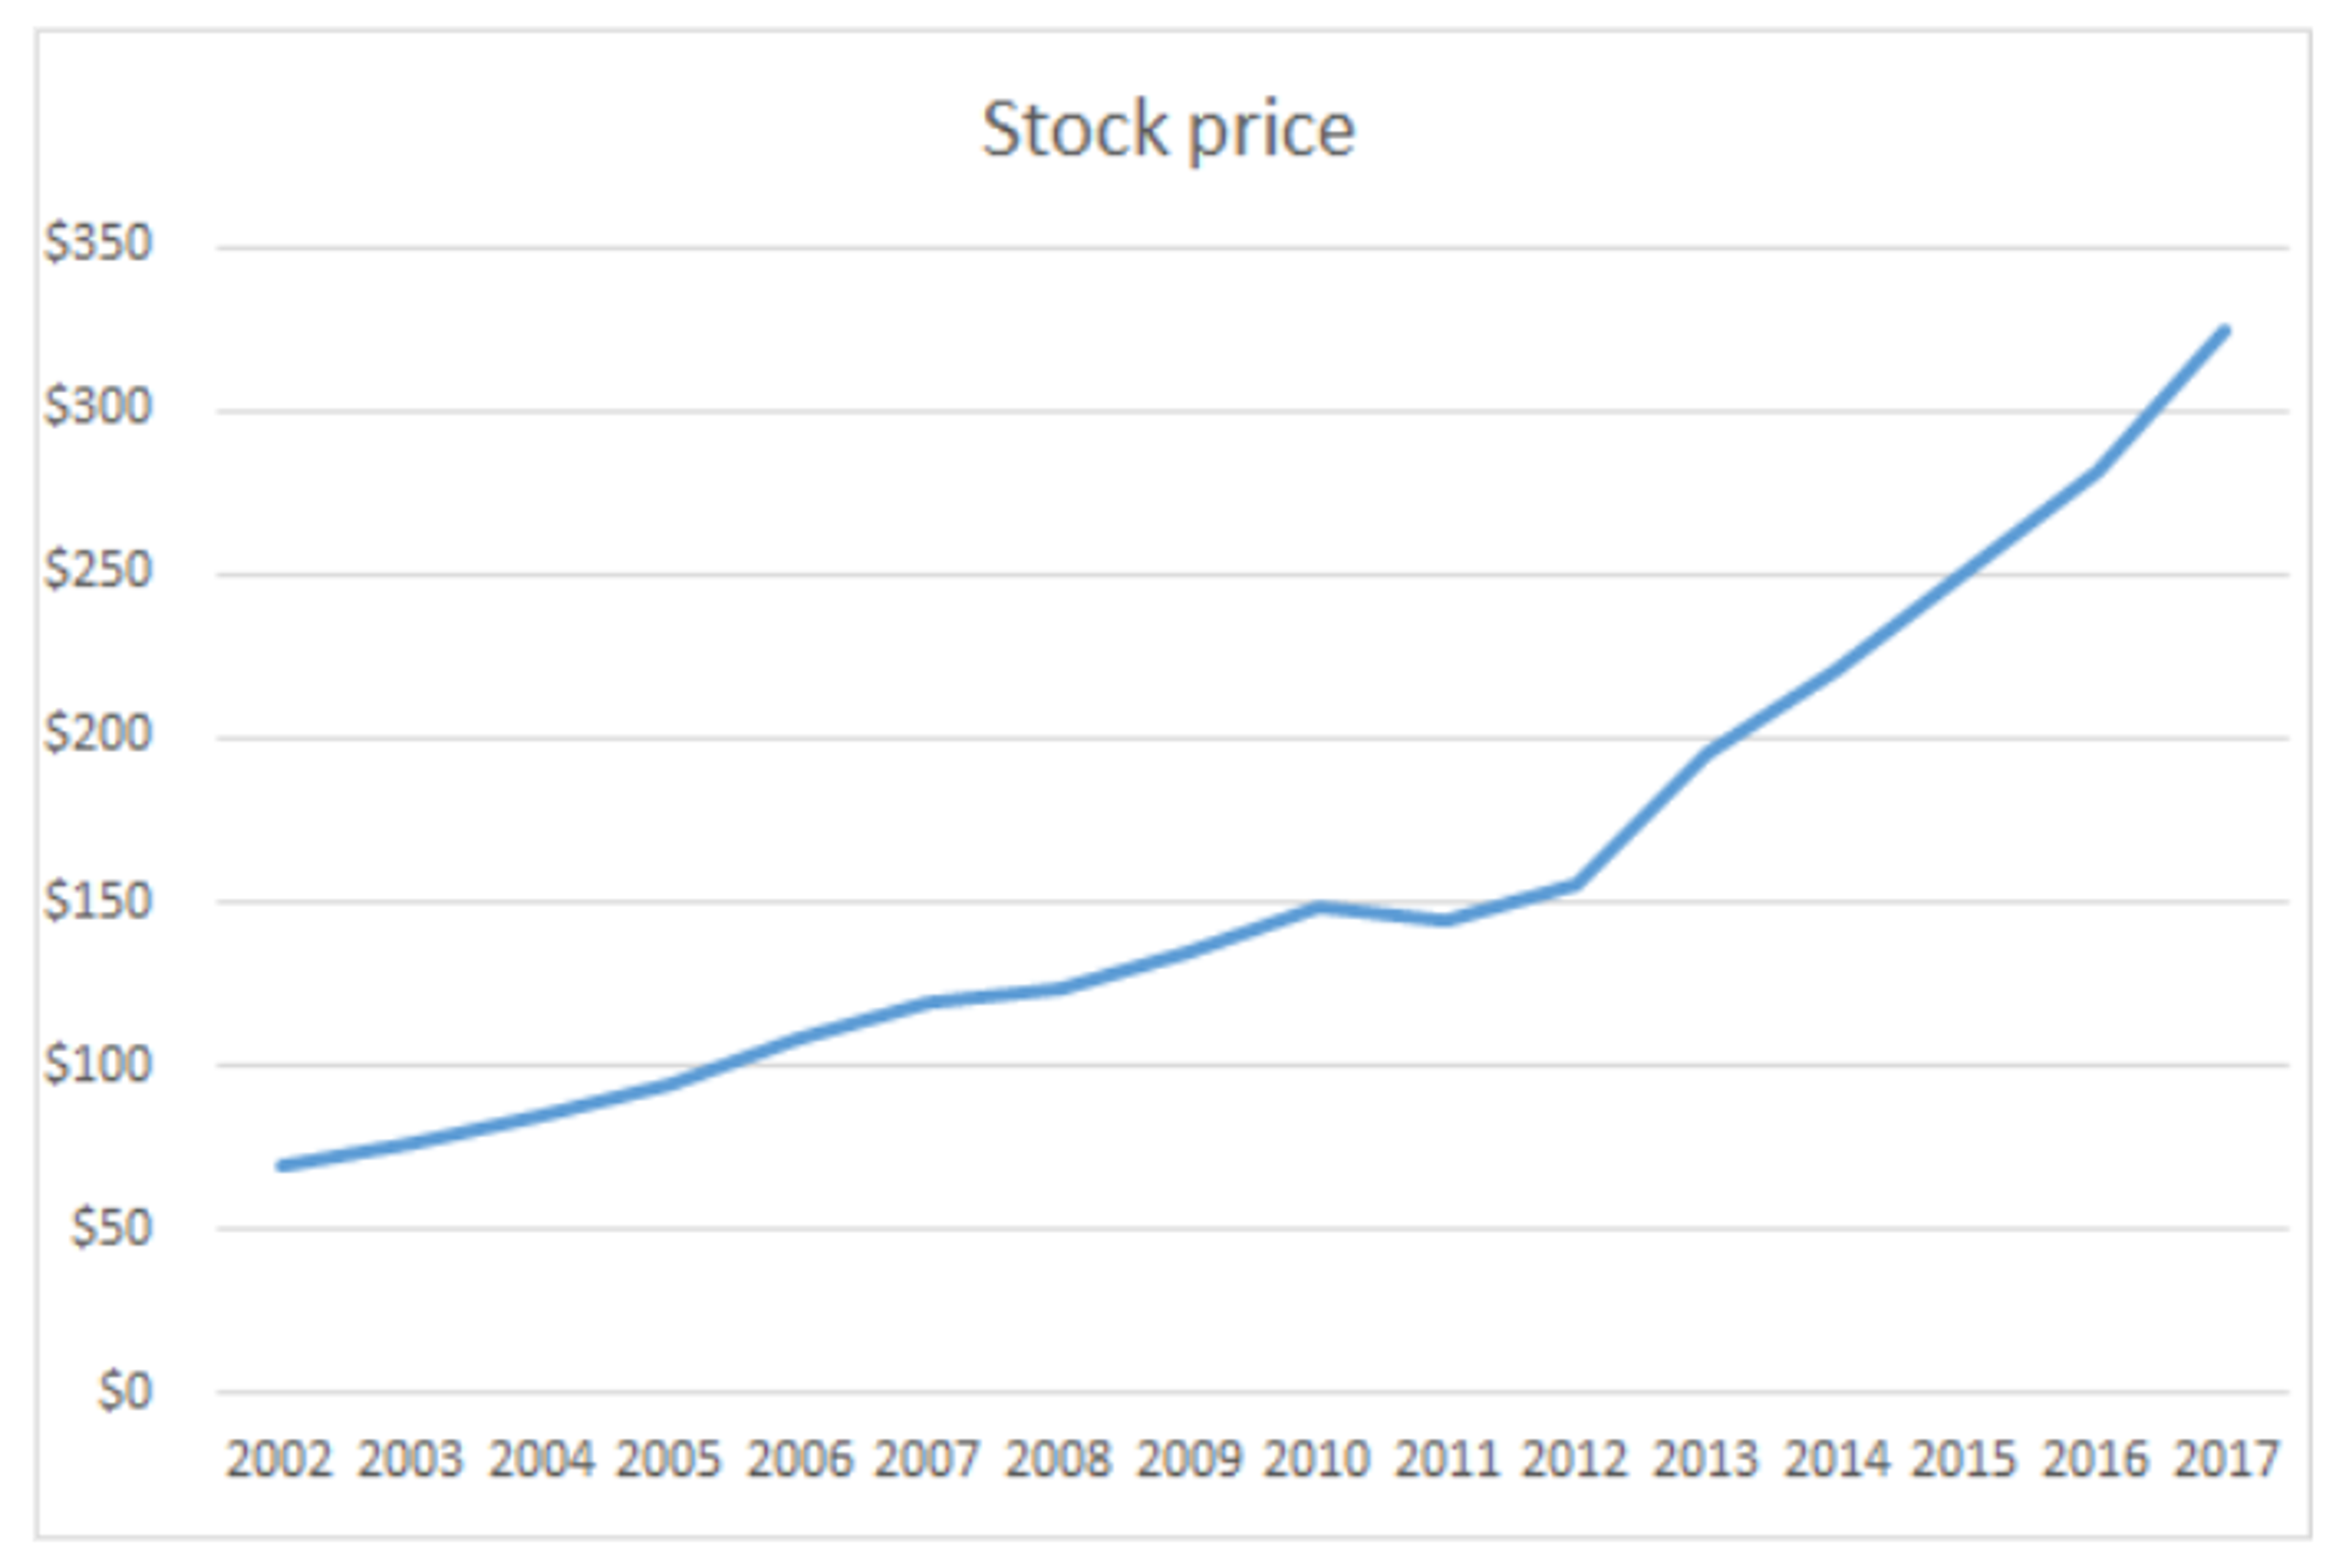
The stock price increased as well, which is a good indicator. If the stock price didn’t increase, you would have gotten a lower price-to-earnings ratio. This looks good, as you’re collecting higher interest on your investment, but again, it isn’t by itself an indication of a healthy company.
2. Helps Determine the Price-To-Earnings Ratio (P/E)
The price-to-earnings (P/E) ratio is one of the most commonly used indicators to analyze a company’s performance. You calculate it by dividing the stock price by the EPS:
P/E = Stock price / EPS
A higher P/E ratio suggests that investors expect lower returns on their investments. A lower P/E ratio suggests that the returns on the investment are higher.
To determine if you are getting a good or bad P/E ratio, compare one company to another in the same sector. If you compare the company to an index, it’ll be even better. Indices represent a group of companies. Even if one of the companies in the index is not accurate in terms of data, the other companies in the index will compensate.

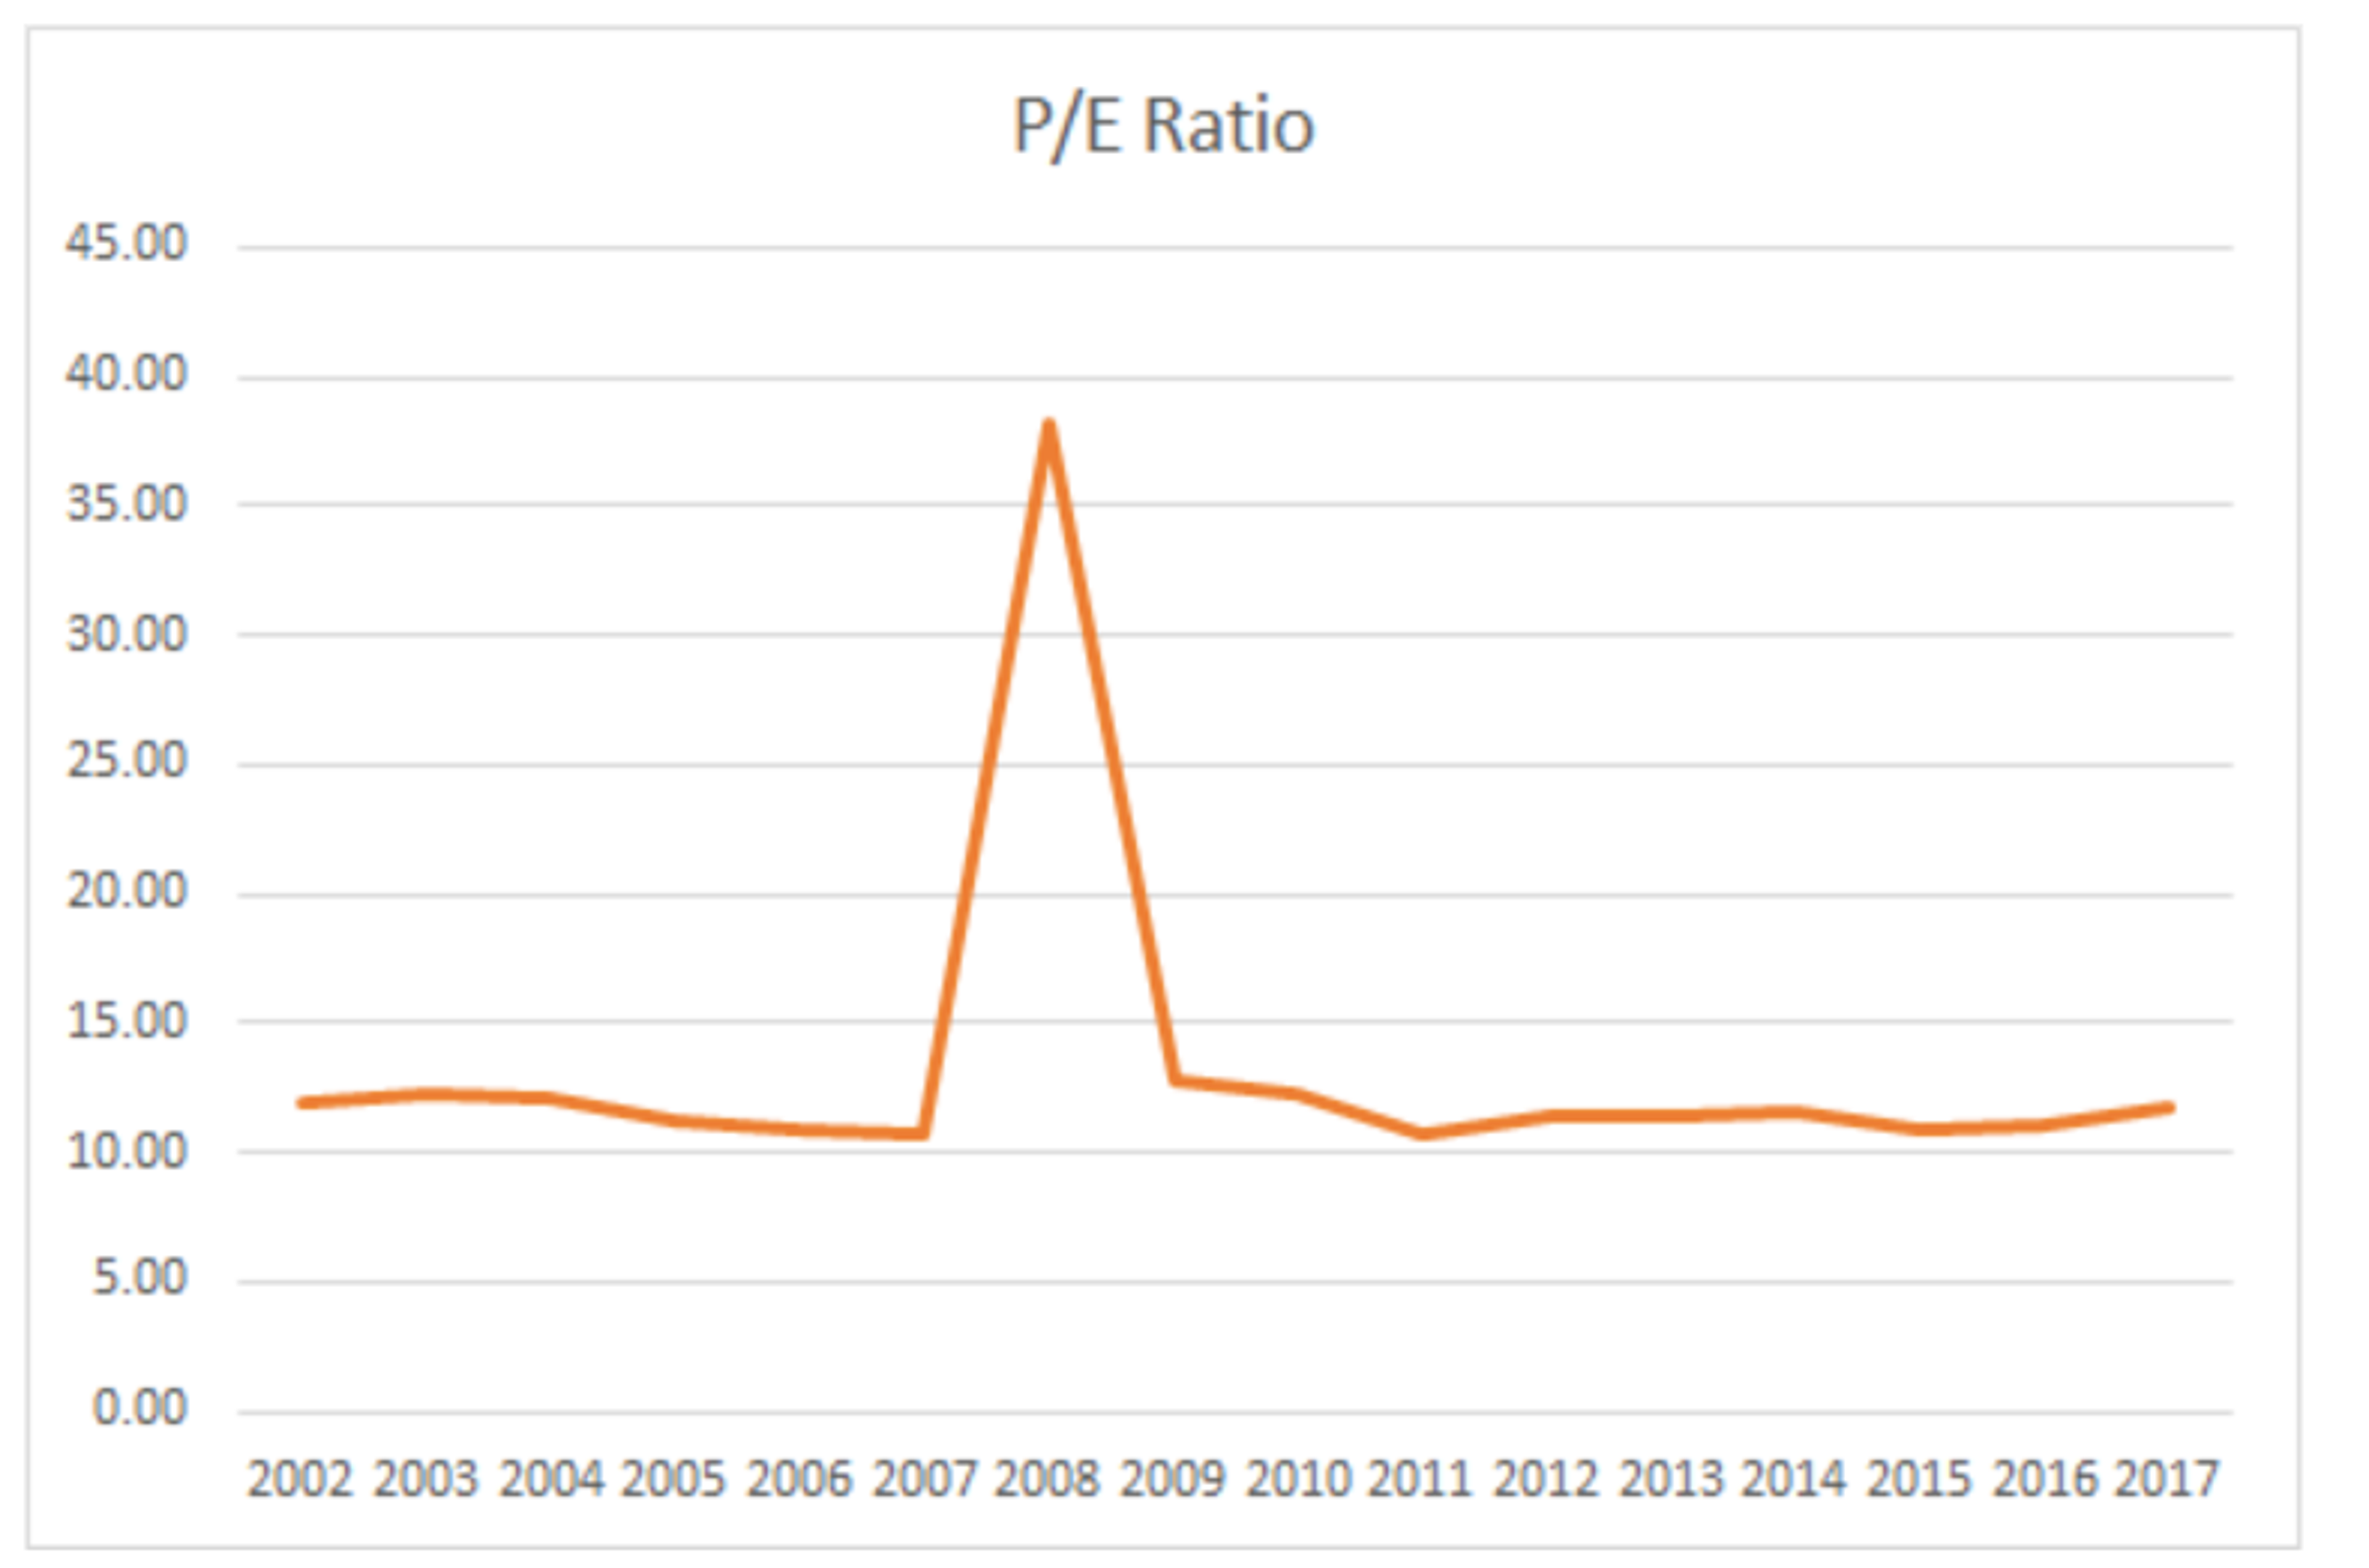
See that the P/E ratio is relatively flat except for 2008, which was the year of the world economic crisis? This means that the stock price and the earnings per share grow evenly and bring a steady yearly growth from the company.
A solid company will not have a specific trend in its P/E ratio. A better scenario would be if the price-to-earnings ratio is flat. If earnings per share is growing, but the stock price stays still, the P/E ratio will decrease exponentially. Although it can bring a one-time profit, it is an indication of an unhealthy company and might have a bubble impact. If the earnings per share stay still, but the stock price grows, then the P/E ratio will increase exponentially. This will soon lead to a stock that brings minimal to no interest.
The Earnings Per Share Formula and Example
You calculate the earnings per share indicator by subtracting the preferred dividends from the net income of the company for a specific period of time and then divide the result by the number of common shares.
EPS formula
Earnings per share = (Net income – Preferred dividends) / Common shares
Example
Let’s say a company has a net income of $200 million for one year and 20 million common shares. If the company has issued preferred dividends of $50 million, then you need to subtract this amount from the net income. Then divide the result by the number of common shares.
- Earnings per share = ($200,000,000 – $50,000,000) / 20,000,000
- Earnings per share = $150,000,000 / 20,000,000 = $7.50 per share
Sometimes companies attempt to manipulate their data to look better in order to attract more investments. When calculating earnings per share, it’s important to know that the earnings are actual and not an accounting trick.
Best Online Stock Brokers
- Best For:Active and Global TradersVIEW PROS & CONS:Securely through Interactive Brokers’ website
- Best For:Global Broker for Short SellingVIEW PROS & CONS:securely through TradeZero's website


Today's Stock Movers
Stock Movers
Gainers
| Ticker | Company | ±% | Buy Stock | |||
|---|---|---|---|---|---|---|
| PLRZ | Polyrizon | $1.00 | 296.6% | 398.92K | Buy/Sell | |
| FRGT | Freight Technologies | $2.08 | 111.21% | 1.85M | Buy/Sell | |
| IBO | Impact BioMedical | $0.74 | 85.62% | 6.07M | Buy/Sell | |
| CLIK | Click Holdings | $0.34 | 58.11% | 1.55M | Buy/Sell | |
| RFAIR | RF Acquisition Corp II - Right | $0.09 | 49.83% | 23.15K | Buy/Sell | |
| CPS | Cooper-Standard Holdings | $21.84 | 43.52% | 311.89K | Buy/Sell | |
| BIVI | BioVie | $1.18 | 36.89% | 312.94K | Buy/Sell | |
| KBSX | FST | $2.05 | 36.63% | 1.28M | Buy/Sell | |
| KIDZ | Classover Holdings | $7.18 | 33.95% | 16.20M | Buy/Sell | |
| INZY | Inozyme Pharma | $1.62 | 33.88% | 523.37K | Buy/Sell | |
| ADPT | Adaptive Biotechnologies | $9.85 | 33.76% | 2.02M | Buy/Sell | |
| STEC | Santech Holdings | $0.96 | 33.19% | 2.07M | Buy/Sell | |
| AIRS | AirSculpt Technologies | $3.00 | 32.52% | 254.14K | Buy/Sell | |
| RGTX | Defiance Daily Target 2X Long RGTI ETF | $31.66 | 31.22% | 94.48K | Buy/Sell | |
| ZYBT | Zhengye Biotechnology | $13.49 | 29.33% | 320.73K | Buy/Sell | |
| AGFY | Agrify | $21.74 | 28.73% | 19.14K | Buy/Sell | |
| CARM | CARISMA Therapeutics | $0.26 | 28.38% | 191.39K | Buy/Sell | |
| FULC | Fulcrum Therapeutics | $5.62 | 28.3% | 401.84K | Buy/Sell | |
| OAKUR | Oak Woods Acquisition Corporation - Right | $0.27 | 27.89% | 18.03K | Buy/Sell | |
| SSP | E W Scripps | $2.44 | 27.01% | 1.31M | Buy/Sell | |
Loser
| Ticker | Company | ±% | Buy Stock | |||
|---|---|---|---|---|---|---|
| CABO | Cable One | $152.25 | -41.89% | 153.20K | Buy/Sell | |
| XYZG | Leverage Shares 2X Long XYZ Daily ETF | $9.98 | -40.98% | 5.51K | Buy/Sell | |
| DPRO | Draganfly | $1.94 | -32.7% | 91.18K | Buy/Sell | |
| EJH | E-Home Household Service | $0.20 | -32.13% | 3.27M | Buy/Sell | |
| PDEX | Pro-Dex | $46.09 | -31.52% | 40.06K | Buy/Sell | |
| PAPL | Pineapple Financial | $0.14 | -29.74% | 184.64K | Buy/Sell | |
| ZCAR | Zoomcar Holdings | $7.55 | -26.69% | 865.79K | Buy/Sell | |
| ARDX | Ardelyx | $4.11 | -24.96% | 4.38M | Buy/Sell | |
| AGMH | AGM Gr Hldgs | $0.07 | -24.58% | 80.62M | Buy/Sell | |
| RAY | Raytech Holding | $1.61 | -23.34% | 2.95M | Buy/Sell | |
| SEM | Select Medical Hldgs | $14.17 | -22.32% | 1.01M | Buy/Sell | |
| RGC | Regencell Bioscience | $60.10 | -21.95% | 672.23K | Buy/Sell | |
| HCTI | Healthcare Triangle | $0.21 | -21.49% | 5.66M | Buy/Sell | |
| LIMN | Liminatus Pharma | $8.00 | -20.56% | 464.33K | Buy/Sell | |
| XYZ | Block | $46.54 | -20.42% | 9.15M | Buy/Sell | |
| WW | WW International | $0.58 | -20.25% | 23.03M | Buy/Sell | |
| TREE | LendingTree | $43.20 | -20.17% | 261.69K | Buy/Sell | |
| XYZY | Tidal Trust II YieldMax XYZ Option Income Strategy ETF | $8.82 | -18.89% | 49.97K | Buy/Sell | |
| MULN | Mullen Automotive | $0.31 | -18.84% | 1.84M | Buy/Sell | |
| BLMZ | BloomZ | $0.17 | -18.13% | 1.35M | Buy/Sell | |
Final Thoughts
Investors trade shares of millions of companies on a daily basis on the world stock markets. Investors evaluate these stocks in different ways. Making forecasts for earnings per share is a very subjective process, which is subject to different factors. Most companies publish their own forecasts about EPS and it’s always a good idea to use this official data.
Don’t get lured by suspiciously high indicators when analyzing a company, as these might not represent the truth. In stock trading, too good is never good. Instead, you should aim to reach consistent growth on your investments.
Consider that to get a specific EPS you need to buy that respective stock. This is why you should always pay attention to the stock price, as it determines if you can afford the investment or not.
Frequently Asked Questions
What do the earnings per share tell you about a company?
The earnings per share show the company’s profits, trends and use of capital.
What are the revenues?
The revenues measure the company’s income from the sales of goods and services.