


A steady diet of healthy earnings doesn’t seem filling enough these days for a bull that once roared. It’s a sea of red this morning following Tuesday’s lackluster session, despite a fresh set of solid results from the retail sector.
A host of predators emerged from the woods to hunt for bulls this morning. First, China tightened regulations on cryptocurrencies, which helped send bitcoin plummeting to three-month lows below $40,000. That’s far from the only thing pressuring Wall Street, but it doesn’t help.
Second, the “dreaded ‘I’ word” (inflation) continues to haunt, as strong economic readings out of Europe this morning led to new fears of overheating. Stocks came under pressure overseas, so that brought some negative momentum. Gold recorded four-month highs early today, which you sometimes see when inflation fears ramp up. Also, the dollar is near its 2021 lows, which tends to raise commodity prices.
People might also be on edge ahead of this afternoon’s Fed minutes. Those words are going to potentially get a closer look than usual for signs of the Fed getting anxious at all about prices. If anyone at the Fed was worried at their last meeting about the current spike of inflation being more than “transitory,” that could raise Wall Street’s hackles even more.
There’s a definite weakness, and we’ll see if the “buy the dip” mentality comes into play. Every time we’ve had these kinds of moves lately, people have come in to buy. Today will be a test after yesterday’s weak close. After the first 30 minutes of the session, it could get interesting.
It wouldn’t be surprising to see selling at first, but what happens after that and especially in the last hour before the close deserves a close look. The last hour could be interesting if the market can find a way to close with more strength after failing to do that yesterday. That negative momentum from the weak close appears to be another factor weighing on stocks this morning.
Key Levels To Watch For Apple, SPX As Bleeding Continues
Tech took the biggest left hook ahead of the open, and appears to be the sector most vulnerable to inflation worries because so many of its components are priced for heavy growth down the road. Apple AAPL shares fell below their 200-day moving average of $123.52 in pre-market trading, and if that leading Tech stock sees follow-through technical selling, the rest of the sector could come under more pressure in sympathy.
Another level to watch is the S&P 500 Index’s (SPX) 50-day moving average of 4076. That area has been a major technical support point for months. Falling through it without a “buy the dip” bounce would suggest that buying interest might be drying up.
Remember to keep things in perspective. The broader market is still up double-digits so far this year, and plenty of signs continue to show the economy recovering nicely as Covid recedes in the U.S. Though Tech stocks are down about 6% from their highs, the broader SPX is only off about 3% and the Dow Jones Industrial Average ($DJI) is only down about 2%. This shows you that in the battle of value vs. growth, value appears to be winning.
The Fed hasn’t moved from its conviction that recent price increases are temporary, and until recently, Wall Street has seemed to accept that theory. Even this morning, Treasury yields aren’t up all that much and the 10-year yield looks relatively tame at 1.65%.
As we pointed out above, another potential bright spot is retail. Lowe’s LOW and Target TGT became the latest major stores to come in with impressive quarters, but it doesn’t seem to matter much on Wall Street. Lowe’s took a pounding in pre-market trading. Like a lot of companies with good earnings, the question around LOW—as we saw with Home Depot HD yesterday—seems to be, “Can they do it again?” TGT resembles a shining star after beating on revenue and same-store sales growth, but it looks kind of lonely out there dressed in green.
While this week’s trading continues to disappoint anyone who hoped for stocks to snap out of their rut, there are some nuggets of hope, especially around reopening. MGM MGM got an upgrade yesterday as many Nevada casinos are back to full capacity and media reports said Amazon AMZN is in talks to buy the company. And here in the Midwest, Chicago announced it would hold the annual Lollapalooza music festival in late July and early August, also with full capacity. That news appeared to help shares of Live Nation LYV on Tuesday.
The “reopening” story is great, and certainly a feel good message for the markets. But you can’t trade on that one thing forever, just like a good earnings season only can bring so much positive sentiment. There’s a lot of people looking for fresh catalysts, and without them, the market is treading water and slowly losing ground. If the bleeding gets worse today, however, remember that selling out of fear is hardly ever a good idea.
Fatigue Taking Hold?
We’re seeing all the signs of a tired market. Unable to hold onto early gains: Check. Volatility edging up: Check. Lower daily highs and lower daily lows? Check.
Tuesday had all of that, and featured a very disappointing end to what looked early on like a bright session. Most of the major indices fell, with Tech really taking a dive after an encouraging start. The Nasdaq 100 (NDX), heavily weighted toward Tech, is now below its 100-day moving average and on pace for a fifth-straight week of losses.
Of course it’s still early in the week, and last week featured a pretty impressive Thursday and Friday turnaround. Most of the recent selling found buyers hanging out below the market, but after a few times of buying and seeing small gains, it’s unclear how much enthusiasm people will have left.
Especially when you consider that Tuesday’s weakness followed some really outstanding earnings reports from two of the most closely followed companies: Walmart WMT and Home Depot. This morning came the follow-up from Lowe’s and Target. Cisco CSCO is expected later today, with Ralph Lauren RL on the hot seat tomorrow morning.
WMT kept its early gains yesterday but HD wasn’t able to hold on, finishing lower.
Diving Into Data And The Dollar
It’s Wednesday, which means get your pencils and scorecards ready for tomorrow morning’s weekly initial jobless claims data. They’ve been trending sharply lower over the last month, and analysts expect to see more of the same.
Consensus for Thursday’s claims print is 460,000, according to Briefing.com, down from 473,000 the previous week. If, by any chance, the number is surprisingly high or low, keep in mind that there can be noise in the data that throws things off in any given week, and the more important metric is the long-term average. The four-week average heading into tomorrow’s report is 534,000, the lowest level since March 14, 2020.
One interesting trend that’s kind of flying under the radar is the dollar’s dip below 90 for the first time since early this year. Back on Jan. 4, the dollar index hit its intraday 2021 low of 89.42, and the S&P 500 Index (SPX) is up 12% since then. Correlation isn’t causation, but it’s tempting to look at that and say the weak dollar might have helped stocks.
A softer dollar doesn’t always imply strength in the equity market, however. Check back to February 2018 when the dollar index hit what for now remains its five-year low of 88.54. Over the following six months, the SPX rose just 3%.
The dollar surged along with stocks in late 2016 and through much of 2017, and stocks surged as the dollar spent most of the post-Covid period trending lower. Based on recent history, it seems fair to say there’s not any predictable correlation between where the greenback goes and how Wall Street performs (see chart below).
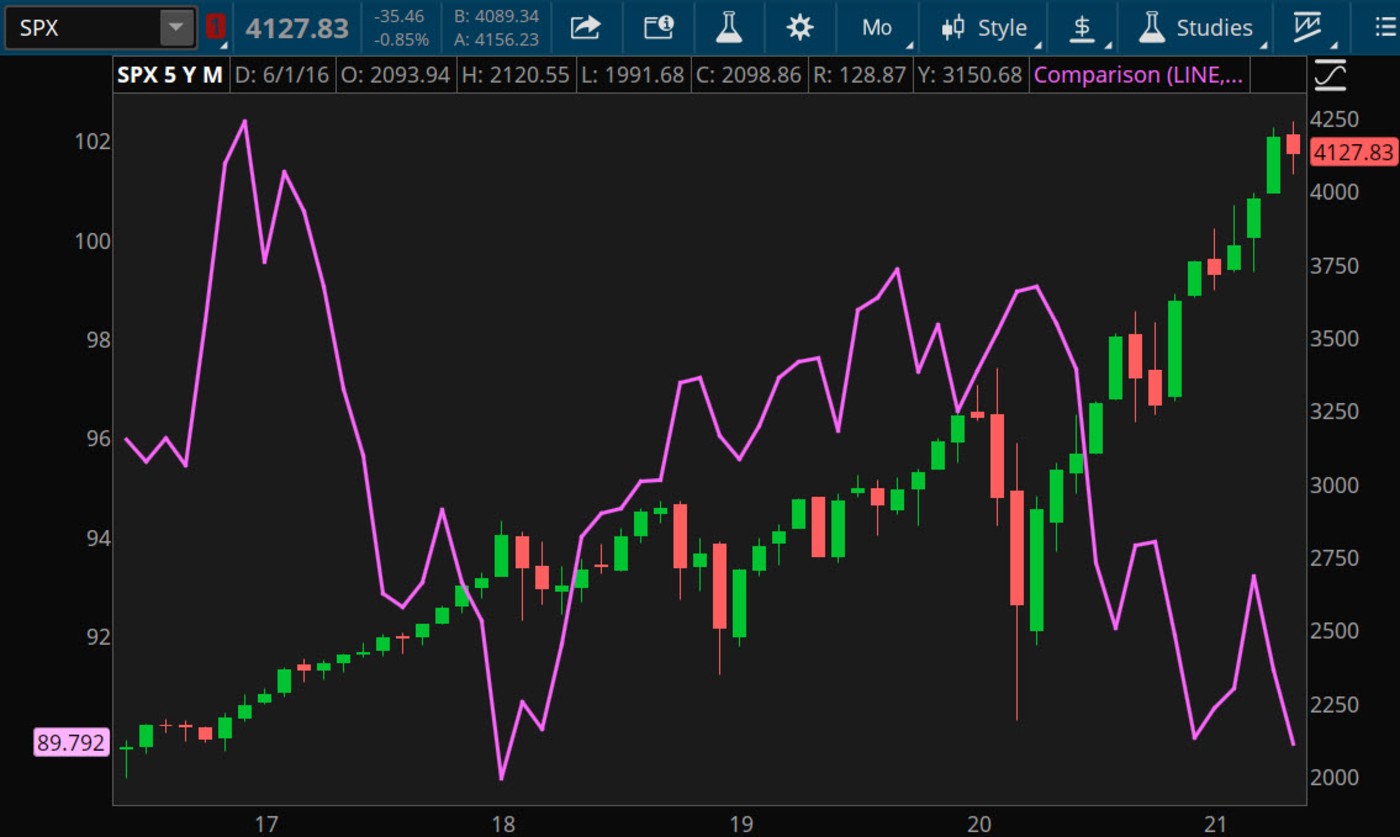
CHART OF THE DAY: ELEMENTARY? NOT EXACTLY. This five-year chart of the dollar index (DXY—purple line) vs. the S&P 500 Index (SPX—candlestick) shows that there just hasn’t been much of a pattern between the broader market and the dollar over the last few years. The dollar is near the low point of its recent range now, but that doesn’t necessarily mean much for the market, judging from this chart. Data Sources: S&P Dow Jones Indices, ICE. Chart source: The thinkorswim® platform. For illustrative purposes only. Past performance does not guarantee future results.
Signs Of New Life In The Travel Industry: As we start hearing, “lose the mask,” the big picture could be better for travel—cruise lines included. In one positive development, we heard Carnival Cruise Lines CCL subsidiary AIDA announce last week the launch of new voyages in Europe. They are opening up bookings for some of their cruises. The cruise sector did very nicely on Tuesday, bucking the market’s overall weakness. Meanwhile, the U.S. Transportation Security Agency (TSA) says numbers of travelers going through airports continue to improve and aren’t dramatically below 2019 levels. They hit nearly 1.85 million on Sunday, down from the average of around 2.6 million a day in the same time frame of the last pre-pandemic year but up about 80% from peaks at the start of 2021. This shows a trend, and could be a really good sign that we are seeing some return to normalcy.
“Value” Sectors, Including Energy, In View After Tuesday Tumble: Finishing lower yesterday were two sectors that have become the darlings of many analysts over the last few weeks: Energy and Financials. The “value” trade had been outpacing growth recently, but Tuesday raised some questions about strength there, though no one day is a trend. Over the last month, Energy and Financials are two of the three best-performing sectors at one and three on the leaderboard (Materials are second). So it will take more than one skittish day to really change the story.
Crude oil’s power over the last month obviously helped inject positive vibes into Energy, but crude stepped back Tuesday and seems to still face a lot of trouble trying to challenge the 2021 high near $68. Today’s U.S. crude stockpiles report—due later this morning—is probably worth watching for a sense of direction in the crude market, and for Energy stocks.
Mind The Gap: After rising from February through April, the wide gap between the U.S. 10-year Treasury yield and the German 10-year bund yield has eased, slightly. The premium of bonds to bunds narrowed from 183 basis points a month ago to 175 on Wednesday. Both yields have risen over that time span, but the bund yield is up more than twice as fast, recently yielding about -11, compared with -26 in mid-April.
This may seem esoteric for stock market investors Still, there’s possibly wider implications. European yields have long lagged U.S. yields, even when the bund yield peaked at 77 in early 2018. At that time, the U.S. 10-year yield enjoyed a more than 200-point advantage. No one is saying the U.S. premium will vanish. However, a narrowing gap could say something good about Europe’s fundamentals. The European Central Bank (ECB) held bond buying steady in April when it last met, but may be under pressure to begin unwinding its Covid stimulus later this year, some analysts say. This could represent a headwind for European stocks if it happens, but the glass-half-full view would tout it as a sign that the economy there—under pressure even before Covid—may be re-emerging. If so, more investors might start sniffing out opportunities in European stocks, which, like European yields, have long lagged their U.S. counterparts but are up about 11% so far this year, just ahead of the S&P 500 Index (SPX). The next ECB meeting is June 10, so stay tuned for any updated economic views.
TD Ameritrade® commentary for educational purposes only. Member SIPC.
Edge Rankings
Price Trend
© 2025 Benzinga.com. Benzinga does not provide investment advice. All rights reserved.
Trade confidently with insights and alerts from analyst ratings, free reports and breaking news that affects the stocks you care about.

