


(Monday Market Open) This week and next could go a long way toward determining how the current quarter plays out on Wall Street.
Between now and February 4, we’ll receive earnings reports from close to half of S&P 500® companies, including 90 this seek. There’s a Federal Open Market Committee (FOMC) meeting next week and a first look at Q4 Gross Domestic Product (GDP) growth this Thursday. It’s a lot to digest, but afterward, investors should have a much better idea of the state of the economy and what the Federal Reserve could have in mind for the near future.
Last week saw the January rally crumble in just over two days before a nice revival on Friday. This recent choppiness has made the market feel like riding a pogo stick, and if you’ve had that experience, you probably know how tough it is to get anywhere.
Two months ago, the S&P 500 index (SPX) traded just below 4,000. It’s in the same territory after Friday’s settlement of 3,972. Significantly, Friday’s close was just above the 200-day moving average of 3,968 for the SPX, perhaps lending some technical strength. Still, it wouldn’t be surprising if the choppiness continues. We’re in a “wait and see” situation as data and earnings roll in.
Keep one more thing in mind this week. China’s reopening economy, mirroring other in Asia, is mostly shut down for the Lunar New Year holiday.


Morning rush
- The 10-year Treasury yield (TNX) is up slightly at 3.5%.
- The U.S. Dollar Index ($DXY) slipped to 101.95.
- Cboe Volatility Index® (VIX) futures rest just above 20.
- WTI Crude Oil (/CL) rose 0.9% to $82.41 per barrel, as commodities, including crude and natural gas, seem to be getting lifted by the softer dollar.
The 10-year Treasury yield rebounded late last week from four-month lows under 3.4% but remains well below recent 3.8% highs. It wouldn’t be surprising to see a tight trading range between now and the next FOMC meeting as market participants await Fed direction. Recent soft U.S. economic data and the Bank of Japan’s (BOJ) decision last week limited yield gains.
Falling yields have been somewhat helpful for stocks lately, but as Barron’s pointed out, stocks are trading like a “soft landing” is in the cards, while bonds “are trading like a recession is nigh.” One or the other probably has to give. We’ll watch some Treasury auctions this week for clues into demand for government debt.
Stocks on the move
This week’s earnings calendar takes us on a grand tour of the economy. Abbott Labs ABT and Johnson & Johnson JNJ will report key results in pharma, and Union Pacific UNP and American Airlines AAL will offer a birds’ eye view into transports. Payment firms like American Express AXP and Master Card MA will offer a vantage point on the consumer, and industrial heavyweights like Dow Chemical (INDEXDJX: .DJI) and Boeing BA will offer a window into business spending overall. Finally, challenges in the tech sector will meet the spotlight with Microsoft MSFT, Texas Instruments TXN, Tesla TSLA, and Intel INTC all reporting.
The week’s calendar also includes Haliburton HAL and Baker Hughes BKR, highlighting the energy services sector ahead of reports from some drilling giants next week. In its last earnings report, HAL—expected to open its books tomorrow morning before the bell—said it expected “structural demand for more oil and gas” to provide a tailwind. HAL sounded especially confident about the North American market, so we’ll see if that confidence was well placed after a 9% revenue growth figure for the region in Q3.
For more insight on projected energy sector earnings, see our energy sector preview.
Research firm FactSet lowered its forecast for Q4 earnings growth Friday to –4.6% from the previous –3.9%. So far, 67% of S&P companies that have reported beat analysts’ estimates on earnings per share (EPS), according to FactSet. That’s well below average levels above 70%.
Data docket
This week also brings the government’s first look at Q4 GDP and the December readings for Personal Consumption Expenditures (PCE) prices, income, and spending.
While GDP is a backward-looking report, the initial government estimate due Thursday morning before the open will likely draw closer scrutiny than usual from Wall Street. The Fed’s been throwing everything it can at the economy, trying to slow inflation. A higher-than-expected GDP reading would call the central bank’s impact into question and raise concerns it might have to get even more aggressive.
The government’s third and final Q3 GDP estimate of 3.2% came in higher than initially expected, and the personal spending component rose to 2.3% in the final report, up from the second estimate of 1.7%. This news wasn’t comforting for those hoping the Fed could find reasons to take its foot off the brakes. We’ll preview Wall Street’s estimates for Q4 GDP tomorrow. The Atlanta Fed’s GDPNow calculator pegs Q4 growth at 3.5%.
Fed prep
Speaking of the Fed, the CME FedWatch Tool now shows a 99% probability of a 25-basis-point hike on February 1. That would be the smallest one since last March. With questions pretty much settled around the Fed’s February 1 move, eyes are turning toward what might happen at the March 21 – 22 FOMC meeting.
While March’s rate direction could change depending on what Fed Chairman Jerome Powell says at his press conference a week from Wednesday, current odds stand at 78% for another 25-basis-point hike, according to FedWatch. A March 0.25% hike would put the Fed’s benchmark borrowing rate between 4.75% and 5%, and the Fed has said it expects rates to eventually top 5%. The odds are only 20% that the Fed will pause in March and leave rates alone for the first time in more than a year.
Reviewing the market minutes
Déjà vu, anyone? Friday felt a lot like 2021 or even 2019. The mega-cap info tech and communication services stocks drove major indexes to sharp gains, led by the usual suspects like Apple (NASDAQ: AAPL), Alphabet (NASDAQ: GOOGL), Microsoft (NASDAQ: MSFT), Nvidia (NASDAQ: NVDA), Tesla (NASDAQ: TSLA), and Meta (NASDAQ: META). These and other “growth” names that regularly delivered slam dunks in those pre- and post-pandemic years. Semiconductors were strong most of last week, and although one week isn’t a trend, firmness in chips can suggest hopes for better economic times ahead because these products run so many components of modern life.
Meanwhile, more defensive sectors like staples, health care, and utilities apparently have lost some of their luster. These are stocks that typically do well when recession fears grow.
Friday’s rally doesn’t mean we can forget what happened Wednesday and Thursday when the SPX sank from above 4,000 to under 3,900. Late January is seasonally a weak time for the market, and the Fed meeting is going to be on traders’ minds. Also, 4,000 has been a serious barrier for the SPX, and we’re approaching it again. You might want to wear a helmet.
Here’s how the major indexes performed Friday:
- The Dow Jones Industrial Average® ($DJI) rose 330 points, or 1%, to 33,375.
- The Nasdaq Composite® ($COMP) rose 2.66% to 11,140.
- The Russell 2000® (RUT) climbed 1.7% to 1,867.
- The SPX rose 73 points, or 1.89%, to 3,972.
So far this year, the $COMP leads all major indexes with gains of 6.4%, followed by the RUT at 6%. The SPX lags at 3.5%.
Talking technicals: A bullish chart formation called a “golden cross” is developing on the SPX. That’s when the 50-day moving average crosses above the 200-day moving average, a signal that recent performance has gained traction over the longer-term trend (see chart below). While it’s not always a guarantee of future strength, an actual golden cross move could spark some technical buying. One argument against putting too much focus on this is that trading volume has been relatively low lately, calling into question just how much conviction there is to take the market higher.
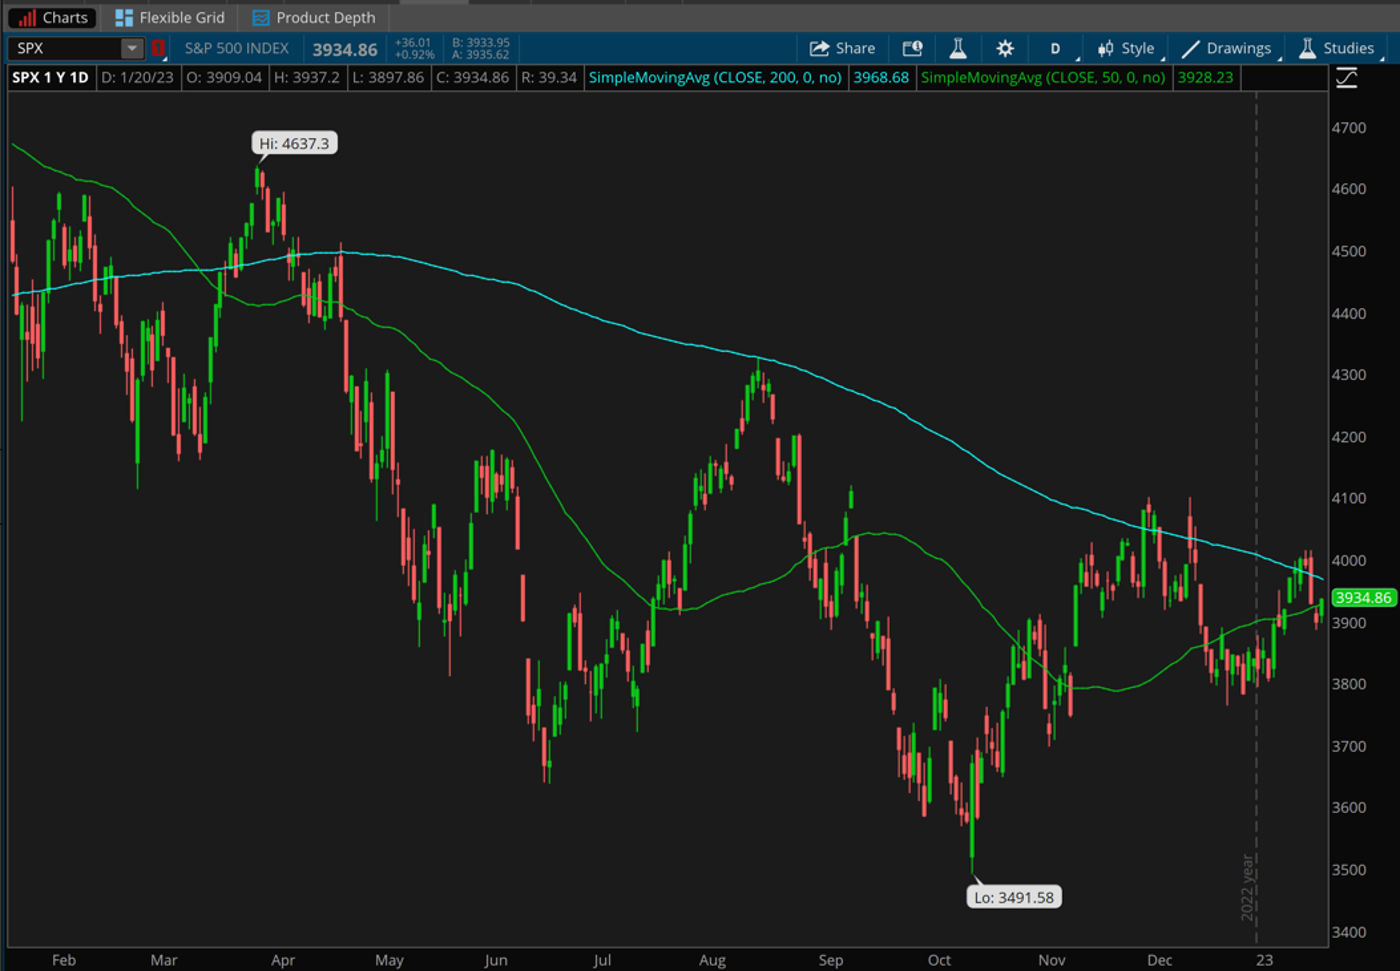
CHART OF THE DAY: GOLDEN POSSIBILITIES. A so-called “golden cross” formation is setting up on the long-term S&P 500 (SPX—candlesticks) chart. That’s when the 50-day moving average (green line) crosses the 200-day moving average (blue line), and technicians see this as a bullish technical sign. Will it happen? Only if the January rally resumes. Data source: S&P Dow Jones Indices. Chart source: The thinkorswim® platform. For illustrative purposes only. Past performance does not guarantee future results.
Three Things to Watch
Debt Debate: Even with so much focus on earnings and the Fed in the coming two weeks, investors shouldn’t ignore what’s happening in Washington, D.C. The nation hit its debt ceiling last week, and the Treasury Department is now taking “extraordinary measures” to pay the country’s bills as Congress and the White House try to resolve their differences on the matter. In 2011, an extended debt ceiling fight led to a downgrade of U.S. debt and a steep slide in the markets before things got settled just days ahead of a possible default.
“In 2011, the market downturn started about a month before the deadline and accelerated as the deadline approached,” according to Schwab Managing Director, Legislative and Regulatory Affairs Michael Townsend. In a recent analysis of how a future debt ceiling battle might affect investors, Townsend wrote, “Market volatility spiked as the deadline drew closer. By all estimates, we are still five to six months away from the crisis point, so market reaction is expected to remain muted in the coming weeks.”
Shhh… One constant source of volatility so far this month vanishes this week as the Fed enters its “quiet period” ahead of the January 31 – February 1 FOMC meeting. Fed speakers opined almost every day last week, and except for Fed Vice Chair Lael Brainard’s’ hopeful remarks Thursday about a possible “soft landing,” it was mostly gloom and doom from the central bank. If nothing else, the Fed’s done a good job getting the market to slow ahead of the FOMC meeting, if that was actually its goal (the Fed is supposed to make its decisions independently of what the market is doing). To some degree, this behavior recalls former Fed Chairman Alan Greenspan’s “irritational exuberance” utterance of 1996 as Fed speakers continued to pound the drum for eventual 5% interest rates, in line with the December FOMC “dot-plot.” But as we’ve noted, the futures market doesn’t reflect that. So, here’s the question. Who will give in first the market or the Fed?
Wallet watch: Consider last week’s small but somewhat perfect storm of news for a potentially turbulent consumer spending outlook. On Thursday, shares of Discover Financial Services (DFS) lost more than 6% despite reporting above-estimate quarterly earnings. One detail seemed to worry investors—DFS’s full-year forecast for credit card net charge-offs came in between 3.5% and 3.9%, well above consensus. If the Federal Reserve continues to raise rates this year, could credit card defaults become a bigger story? Last Wednesday—the same day that falling December retail sales numbers shook the market—CreditCards.com reported that the average credit card interest rate now stands at 20.16%, up more than 4 percentage points year over year. So, some might wonder whether holiday shoppers were exercising maximum inflationary caution—or were simply maxed out.
Notable calendar items
Jan. 24: Expected earnings from Johnson & Johnson (JNJ), Microsoft (MSFT), Lockheed Martin (LMT), General Electric (GE), 3M (MMM), Union Pacific (UNP), and Verizon (VZ)
Jan. 25: Expected earnings from Abbott Labs (ABT), Boeing (BA), AT&T (T), IBM (IBM), Tesla (TSLA), and Whirlpool (WHR)
Jan. 26: December Durable Goods and Durable Orders, Q4 GDP (first estimate), December New Home Sales, and expected earnings from American Airlines (AAL), Mastercard (MA), Southwest Airlines (LUV), Dow Chemical (DOW), Alaska Air (ALK), and Blackstone (BX)
Jan. 27: December PCE Prices, Final January University of Michigan Consumer Sentiment, and expected earnings from American Express (AXP) and Chevron (CVX)
Jan. 30: Expected earnings from GE HealthCare (GEHC) and Philips (PHG)
Jan. 31: Start of FOMC meeting, January Chicago PMI, December Consumer Confidence, and expected earnings from ExxonMobil (XOM), General Motors (GM), Pfizer (PFE), McDonald’s (MCD), Caterpillar (CAT), and UPS (UPS)
February 1: FOMC rate decision, December Construction Spending, January ISM Manufacturing, and expected earnings from Altria (MO), Peloton (PTON), and Waste Management (WM)
TD Ameritrade® commentary for educational purposes only. Member SIPC.
Image sourced from Shutterstock
This post contains sponsored advertising content. This content is for informational purposes only and not intended to be investing advice.
Edge Rankings
Price Trend
© 2025 Benzinga.com. Benzinga does not provide investment advice. All rights reserved.
Trade confidently with insights and alerts from analyst ratings, free reports and breaking news that affects the stocks you care about.

