Even better, management brought to the table exciting developments, such as the opening of 31 new shops (30 of which were company-operated) across 13 states. Further, systemwide same shop sales increased 6.1%, while systemwide same shop transactions increased 3.7% relative to the same period in 2024.
Still, it's hard to disagree with Dutch Bros CEO Christine Barone, who argued that the "business continues to fire on all cylinders." What's more, options traders may be able to sneak in some quick profits off this hot name.
Serving Up Profits To Go With BROS Stock
Although the fundamental narrative for Dutch Bros is arguably enticing, it's difficult to extract a specific trading strategy from the storyline. Because options have defined profitability thresholds (on an intrinsic basis) and due to their expiration dates, traders must deal with a multidimensional risk profile: they have to be right on both the direction and the timeline.
Continuous signals are by nature unbounded, which means that they lack objective meaning. As far as I'm aware, the only objective truth in the equities sector is that, at the end of the day, the market is either a net buyer or net seller. While this sounds remarkably elementary, we can use this framework to decipher patterns and probabilistic transitions.
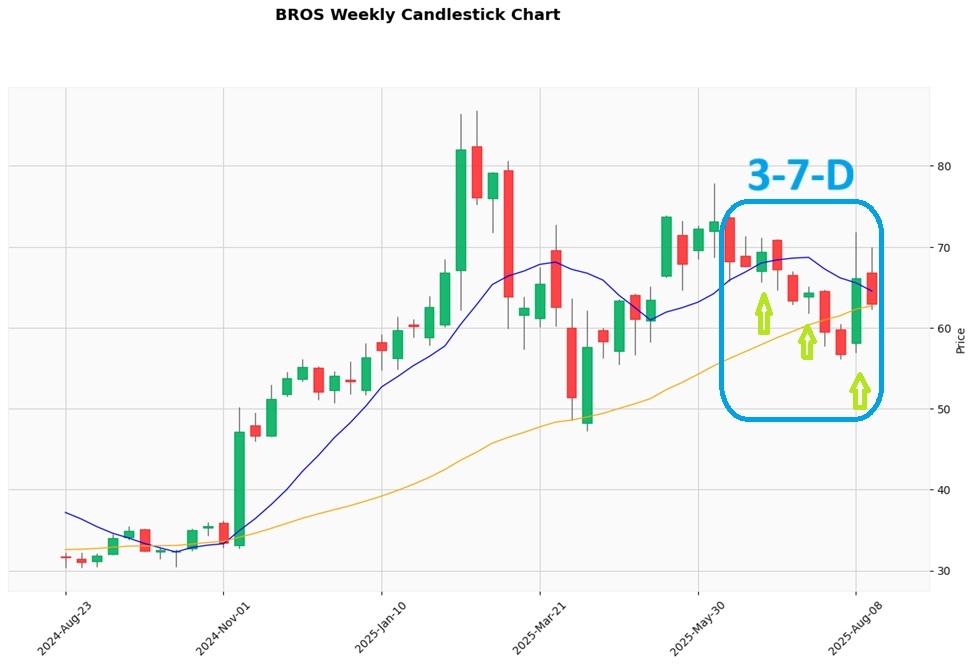
For example, in the past 10 weeks (not inclusive of this one), the market has voted to buy BROS stock three times and sell seven times. During this period, the security incurred a downward trajectory. For brevity, we can label this sequence as 3-7-D.
Now, before we get into analyzing trading signals, any proposed methodology must on paper beat the normal expected probabilistic performance of BROS stock. In other words, the null hypothesis (or the assumption of no mispricing) is equivalent to the chance that, on any given week, a long position in BROS will rise. This probability, going back to its September 2021 initial public offering, is 49.27%.
In contrast, our alternative hypothesis in the form of the 3-7-D sequence shows that the upside probability is 77.78%. This metric actually holds because of the strong performance of BROS stock today. However, it's very interesting that the median one-week return is 5.05%, suggesting that there's still growth to be extracted.
Targeting A Potentially Sustained Rally
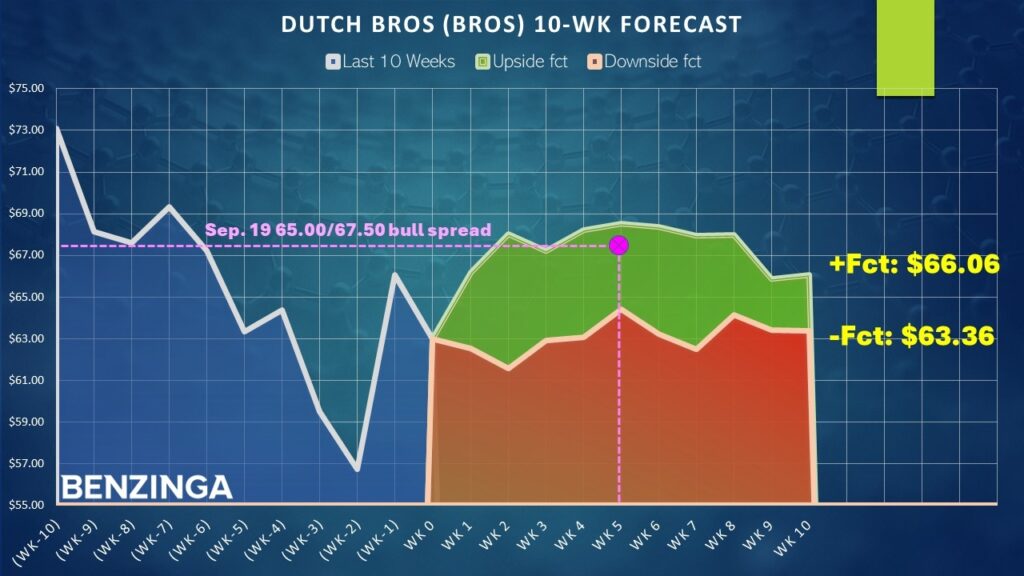
Based on the market intelligence above, the transaction that might make the most sense is the 65.00/67.50 bull call spread expiring Sep. 19. This transaction involves buying the $65 call and simultaneously selling the $67.50 call, for a net debit paid of $125 (the most that can be lost in the trade). Should BROS stock rise through the short strike price ($67.50) at expiration, the maximum profit is also $125, a 100% payout.
Why does this trade make sense? If the bulls maintain control of the market following the 3-7-D sequence, BROS stock is expected to peak five weeks from now at a median price of $68.54, which coincides with the Sep. 19 expiration date. Because it's the median value, there's a possibility that BROS could swing higher.
Subsequently, it's not out of the question to consider the 67.50/70.00 bull spread, which features a massive payout of nearly 178%. However, it's not probabilistically likely, which is why I prefer the more conservative 65.00/67.50 spread.
Either way, what's really fascinating is the empirical validity of the 3-7-D sequence. Running a one-tailed binomial test reveals a p-value of 0.0132, which indicates that there's only a 1.32% chance that the implications of the signal could materialize randomly as opposed to intentionally. Though this doesn't guarantee success, the metric implies statistical significance.
Whatever the case, you'll want to keep your eyes glued on BROS stock this week. While today's rally has been impressive, there could still be more gains available.
Read More:
Photo: Shutterstock
© 2026 Benzinga.com. Benzinga does not provide investment advice. All rights reserved.
To add Benzinga News as your preferred source on Google, click here.