Market Overview
Stocks I Like
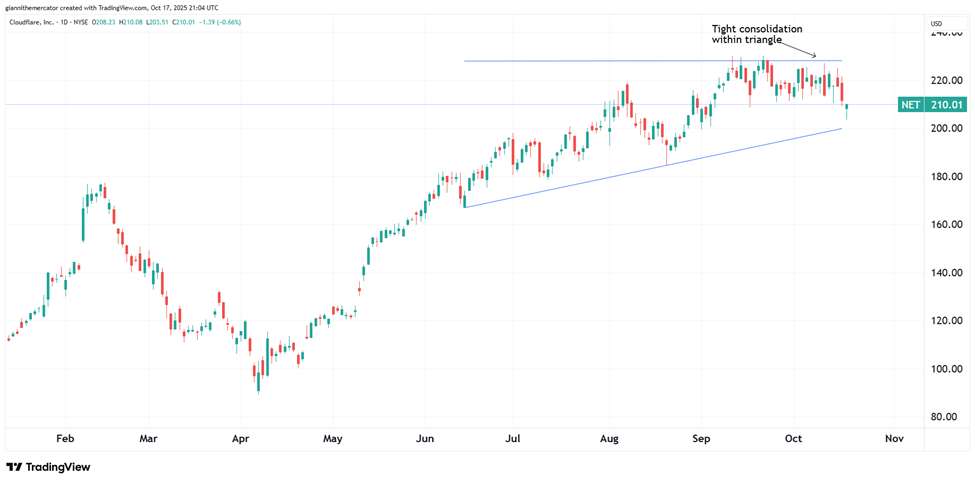
Cloudfare (NET) – 81% Return Potential
What's Happening
Why It's Happening
My Action Plan (81% Return Potential)
- I am bullish on NET above $188.00-$190.00. My upside target is $380.00-$390.00.
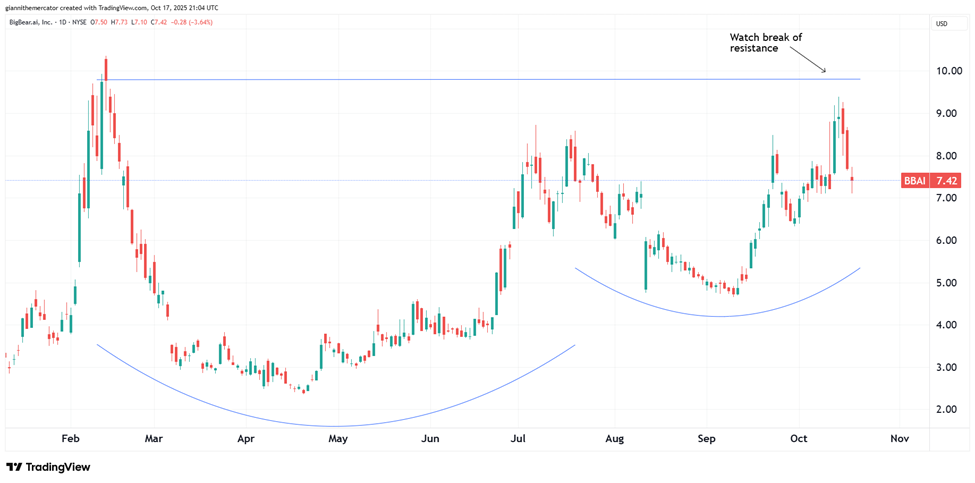
BigBear.ai Holdings (BBAI) – 129% Return Potential
What's Happening
Why It's Happening
My Action Plan (129% Return Potential)
- I am bullish on BBAI above $6.80-$7.00. My upside target is $17.00-$18.00.
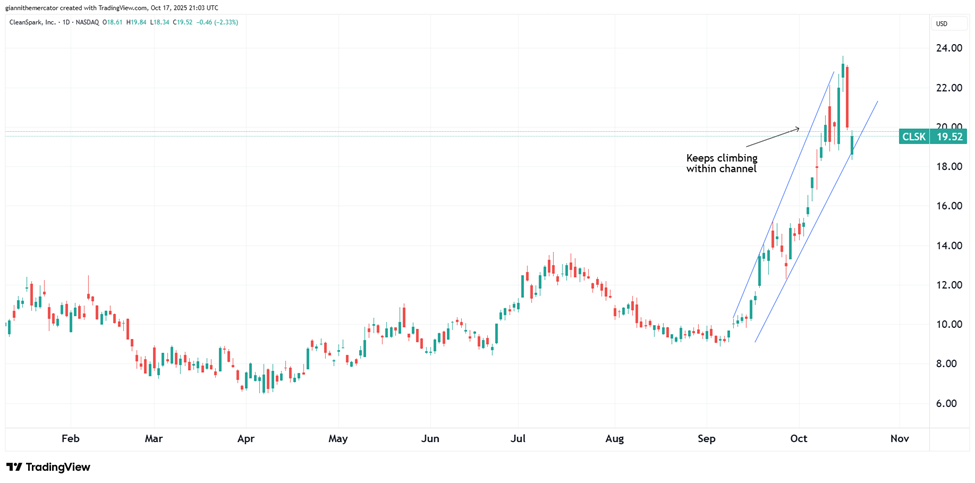
CleanSpark (CLSK) – 95% Return Potential
What's Happening
Why It's Happening
My Action Plan (95% Return Potential)
- I am bullish on CLSK above $17.00-$18.00. My upside target is $38.00-$40.00.
Market-Moving Catalysts for the Week Ahead
Can You Feel the Tension in the Air?
All it took was a one day drop. We got the momentum reset. Fear is the predominant emotion in the tape right now, and all it took was a major misunderstanding about trade negotiations with China in order to cause this major shift.
I always like to say that sentiment follows price, not the other way around. Stocks are a week off the all-time high, and we haven't even hit a new low in prices yet. Even so, the number of bears climbed significantly across various sentiment surveys.
This creates a perfect backdrop for the market to complete another low. Remember that there are bullish seasonal factors coming into play now as well. It's a pretty good combination of factors that are pointing to another reversal and a rally back to new all-time highs sooner than later.
Government Shutdown – Buy the Rumor, Sell the News?
We're going on more than two weeks so far on this government shutdown, and it doesn't seem like much progress is happening. Historical cases of government shutdowns have been generally bullish for stocks, but it's good to bring up the 2018 example.
Granted, 2018 was a mid-term year, and we're not in one now. But Trump was president then too, and it coincided with a sharp correction into the infamous Christmas Eve low of 2018. This then kickstarted a soaring market into 2019.
Does this same script play out this time? It never follows it exactly. All we can do is focus on the strongest stocks in the strongest sectors, and focus on managing risk. Don't worry so much about selling the absolute high or buying the absolute low.
Sector & Industry Strength
There is so much noise in the tape right now, it's truly remarkable. But when we zoom out and look at the money flows, we don't see any significant changes in the tape. In other words, bears aren't asserting themselves, which begs the question – is this a giant overreaction?
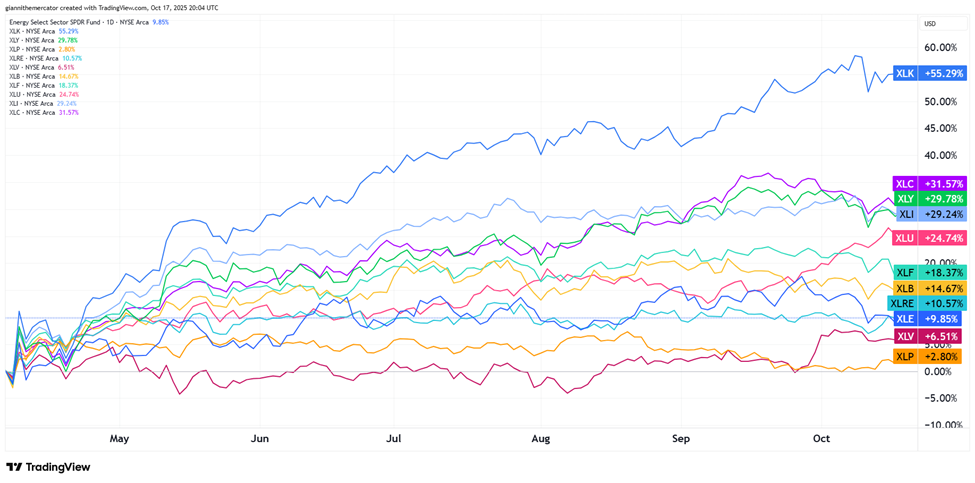
Technology (XLK) is still, by far and away, the top performing sector going back to the April lows. In fact, the only real change from last week is that real estate (XLRE) overtook energy (XLE) in terms of performance from April. The only signal that represents is rates going lower.
If anything, lower rates should be a tailwind for the tech sector (XLK) and consumer discretionary (XLY). All of this price action just seems like a giant rotation, and for those that are overleveraged, it's very painful.
| 1 week | 3 Weeks | 13 Weeks | 26 Weeks |
| Real Estate | Utilities | Utilities | Technology |
Editor's Note: Real estate popping into one-week leader signals lower rates are on the horizon.
Do We Need the Power or the Tech More? (Sector ETF: XLU/XLK)
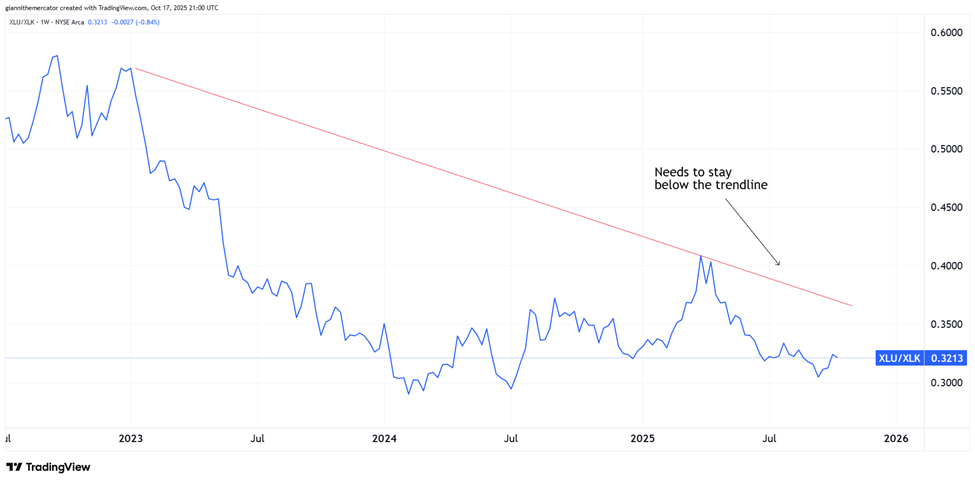
Power and nuclear stocks have become the talk of the trading town in recent weeks, as the utilities (XLU) sector is neck and neck against the tech sector (XLK) in terms of outperformance year-to-date.
The consequences of this are profound, because utilities outperforming often signals that downside risks are creeping into the market. At least, this was the traditional read on this money flow. Could it have evolved to adapt to the modern AI economy? It's a conversation worth having.
Fortunately for bulls, the trend in this ratio is still very much in favor of technology (XLK), as seen by the series of lower-lows and lower-highs. As long as this ratio stays below the downward sloping trendline, I'll continue to favor tech over utilities.
Commodities Still Asleep (Sector ETF: DBC/SPY)
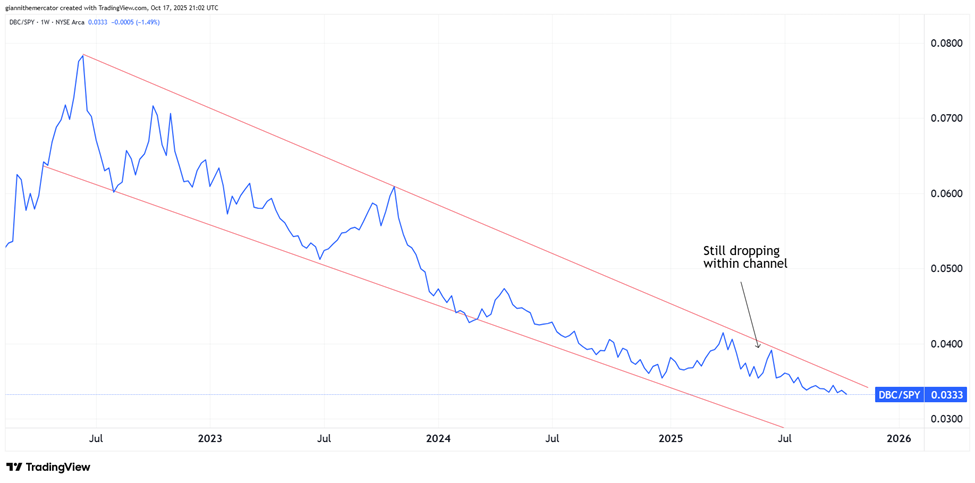
With more rate cuts coming, it's more important than ever to keep a close watch on the commodities (DBC) sector, especially compared against the S&P 500 (SPY). This is a key ratio to watch when it comes to inflationary momentum.
Basically, when DBC is outperforming SPY and the ratio is rising, it means that inflationary pressures are accelerating to the upside. You can still have inflation when this ratio is falling, but it won't be accelerating.
This is exactly what we've had lately – disinflation. When inflation is not accelerating, but still present, stocks offer the best refuge to protect and even grow your wealth, but when inflation starts running hot again, stocks turn volatile and it's important to hide in commodities.
Liquidity Set to Improve Even More (Sector ETF: LQD/IEI)
Fed Chair Powell gave us a pretty big signal last week when he said the end of Quantitative Tightening (QT) was here. Bond markets have been holding up pretty well, and it's important to remember that the first rate cut technically happened in the summer of 2024.
It's time to check back in on the ratio between investment-grade corporate debt (LQD) and 3-7 Year Treasuries (IEI). As a reminder, we want to see LQD outperforming IEI – it signals that markets are willing to avoid the "safety" of Treasuries and reward risk-taking.
I've been tracking the rounding bottom formation in this chart for a couple of years now. The fact that it's been going on so long suggests that a monumental move will come out of this breakout. We just need to close above the upper horizontal trendline acting as resistance.
My Take:
When liquidity conditions improve, you're just not going to get big market crashes. Yes, you'll get quick, sharp reversals that don't last, but most of the time, the declines are very slow and drawn out.
This is why I'm so excited about the recent volatility. It shook out the excess leverage, it reset sentiment, and now, we're seeing the right leadership come out of this low. It looks like seasonality is going to start taking over here soon too, which should be bullish.
Cryptocurrency
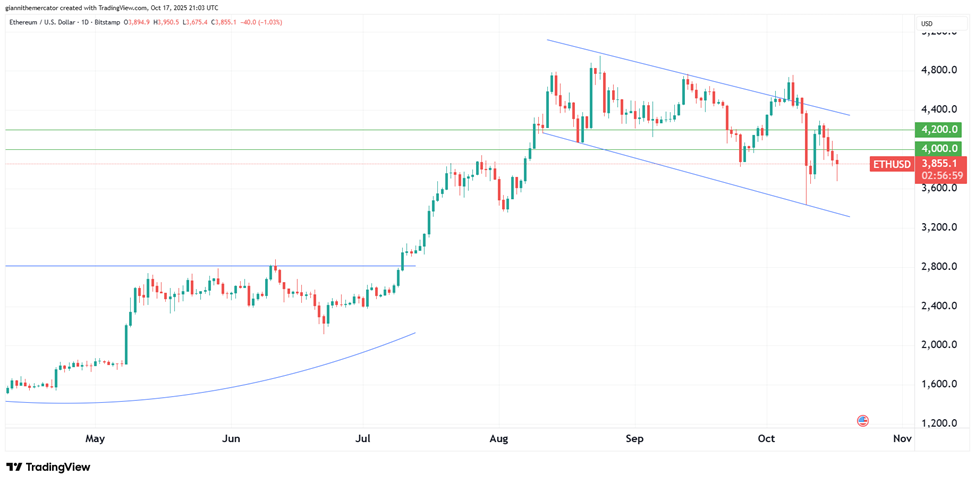
Time to have another look at Ethereum. It's crazy to think that this cryptocurrency has been correcting from its all-time high for the past two months. Prices dropped to a multi-month low a couple weeks back, but held support nicely in the 3300-3400 zone.
Prices are back in the 4000-4200 zone. This is resistance near-term, but the more we see Ethereum test this zone, the more likely it is to break. Despite the lower-lows and lower-highs over the past couple months, I'm most keen on Ethereum holding above the August 3 low at 3355.
I'm eyeing the descending price channel setup on Ethereum's chart. This is a continuation pattern, and if we see a rally back above the upper trendline of the channel, it would signal that a rally up to 5700-5800 is starting.
Legal Disclosures:
This communication is provided for information purposes only.
© 2026 Benzinga.com. Benzinga does not provide investment advice. All rights reserved.
To add Benzinga News as your preferred source on Google, click here.