


Do words have the power to move markets? Yes and no.
When words are used to telegraph policy moves, such as the Fed’s recent change from 2% “inflation targeting” to 2% “inflation averaging,” the markets took those words as a hint that the Fed would keep interest rates low for longer than previously expected. And at this week’s FOMC meeting, Chair Powell essentially said the central bank would be keeping its zero interest rate policy intact until 2023.
But where words meet fundamentals, words can lose their impact. Much as the Fed would like to see a return of inflation, its own policy projections have inflation running well short of the target for a number of years.
Trade policy and tariff threats are another area where words have been used to guide expectations—something that moved markets quite a bit last year, but at times lost their power when realities went the other way. That dynamic is back in the news these days, with recent wranglings over the future of TikTok—which may or may not be scooped up by Oracle Corporation ORCL.
And now the questions are swirling from the Commerce Department about Tencent Holdings TCEHY and its WeChat platform. Again, it starts with words, and may or may not end with real changes. That’s part of the ebb and flow of markets. But TCEHY shares fell 3% on the news. No one knows where this is going, but one thing that does seem evident is it’s a very risky thing to place your bets now. There’s probably going to be more to this story.
Why all this talk of words? We’re going to hear a lot of them soon. With the FOMC meeting out of the way, its members return to the speaker circuit. Today’s schedule includes St. Louis Fed President James Bullard, Atlanta Fed President Raphael Bostic and Minneapolis Fed President Neel Kashkari. And let’s not forget there’s an election coming up in less than two months, with the first debate between Donald Trump and Joe Biden coming up a week from Tuesday, on September 29.
Amid all this, it’s important to remember that words can move markets in the short term, if they’re perceived to be signals of an impending change. But in a battle between perception and reality, reality wins, eventually.
Pre-Weekend Roundup
While mega-caps like Apple Inc. AAPL, Amazon.com, Inc. AMZN, Microsoft Corporation MSFT and Facebook, Inc. FB have lost 10% or more this month, crude prices are on track for 9% gains just this week, rising again early Friday. That’s a 180 from where things were this summer when FAANGs cruised and crude sputtered. Crude rose today after Saudi Arabia pressed allies to stick to production quotas, while some banks—including Goldman Sachs (GS)—predicted a supply deficit.
The FAANGs got crunched again yesterday, with all of them and MSFT dropping 1% to 3%. By this morning, most were posting small gains in pre-market trading, so we’ll see if that continues.
Another thing to keep an eye on today is September consumer sentiment from the University of Michigan, due soon after the open. Consensus is for a headline read of 77.0, up from 74.1 last time out.
It’s always a good idea to watch sentiment, but maybe even more now in these COVID times. Retail sales for August didn’t really look too amazing by any stretch of the imagination, and that raises questions about how consumers are hanging in there with unemployment still high. Consumer spending is a huge portion of economic activity and it needs to be robust for better gross domestic product (GDP) growth.
Get Out The Broomsticks: Quadruple Witching Today
Today could be interesting from a volatility standpoint. Remember, it’s “quadruple witching,” the Friday each quarter when contracts for stock index futures, stock index options, stock options, and single-stock futures all expire. This can make things move more quickly and dramatically than usual, especially around the open and close. So if you plan to trade, consider doing so with extra care.
Friday dawns after the Nasdaq (COMP) again fell into “correction” territory yesterday, down 10% from its recent highs. The positive aspect is seeing what looked like some people “buying the dip” late in the session. This might be muscle memory, to some extent.
Buying the dip in Tech worked most of the summer, but so far it hasn’t really in September. Each rally that’s started this month exhausted itself pretty fast. Generally, we’ve seen a lot of profit-taking in Tech lately, which arguably makes sense after the parabolic run it had. You could even say this is a healthy development, especially if it starts to get Tech valuations more in line with the broader market. It’s usually good to see most sectors on the upswing, not one 100 feet ahead of the pack.
On a positive note, the S&P 500 Index (SPX), which has a heavy-weighting to the mega-cap Tech and Communication Services sector, once again managed yesterday to bounce off support near the 50-day moving average just below 3340. The 50-day has now held on several tests this month, meaning maybe there’s continued buying support there (see chart below).
It’s especially impressive—if you follow technicals—that several times the SPX has dipped below the 50-day in intraday trading recently and then plowed back to close above it, like on Thursday. Whether that can keep happening is a question mark, but probably something worth watching. Any close below the 50-day would probably be viewed as technically weak and possibly a move that could generate more selling.
Another thing probably worth watching is the Cboe Volatility Index (VIX), which continues to run below 30. At times, it’s approached that level this week, but hasn’t gotten much traction on upswings. The futures complex does indicate that traders expect volatility to rise over the next month, but not to sky-high levels. There’s been intraday volatility lately, but that intraday movement hasn’t really gone anywhere as VIX remains relatively tame.
A Few Sector Bright Spots
Though Thursday may have felt like a washout, there were a few winners among sectors—and from a classic economic growth standpoint, it could be promising. The three sectors in the green—Materials, Industrials, and Energy—are those that might be top of mind when you think “economic recovery.” Construction mainstay Caterpillar Inc. CAT, along with industrial giants Dow Inc DOW, and 3M Co MMM were among the Dow Jones Industrial Average ($DJI) components atop the leaderboard.
Energy biggies ConocoPhillips COP and Chevron Corporation CVX also advanced as crude reclaimed the $40 handle. Though rising crude prices certainly looks like a positive in terms of economic recovery, it’s fair to note that much of the rebound is due to the supply side. Upwards of 25% of the Gulf Coast oil infrastructure went offline this week as Hurricane Sally barreled through, and yesterday’s report from OPEC (see more below) showed members seeming to stick by their commitment to pare output.
But there are two sides to that coin. Output has been cut to match diminished demand, so there may be a limit to any exuberance here. Still, seeing the cyclical sectors in the green on an otherwise red day is something the market can hang its hat on.
Don’t forget to watch the dollar index either, in part because its weakness might be contributing to crude’s rally. The greenback has been trading in a tight range mainly between 92 and 93 recently, near its lows for the year. Earlier this summer, the dollar weakened and Tech stocks went through the roof, but now that relationship appears to be breaking down. A weaker dollar and weaker COMP are features lately. Still, the 92 level has held pretty well for the dollar so far.
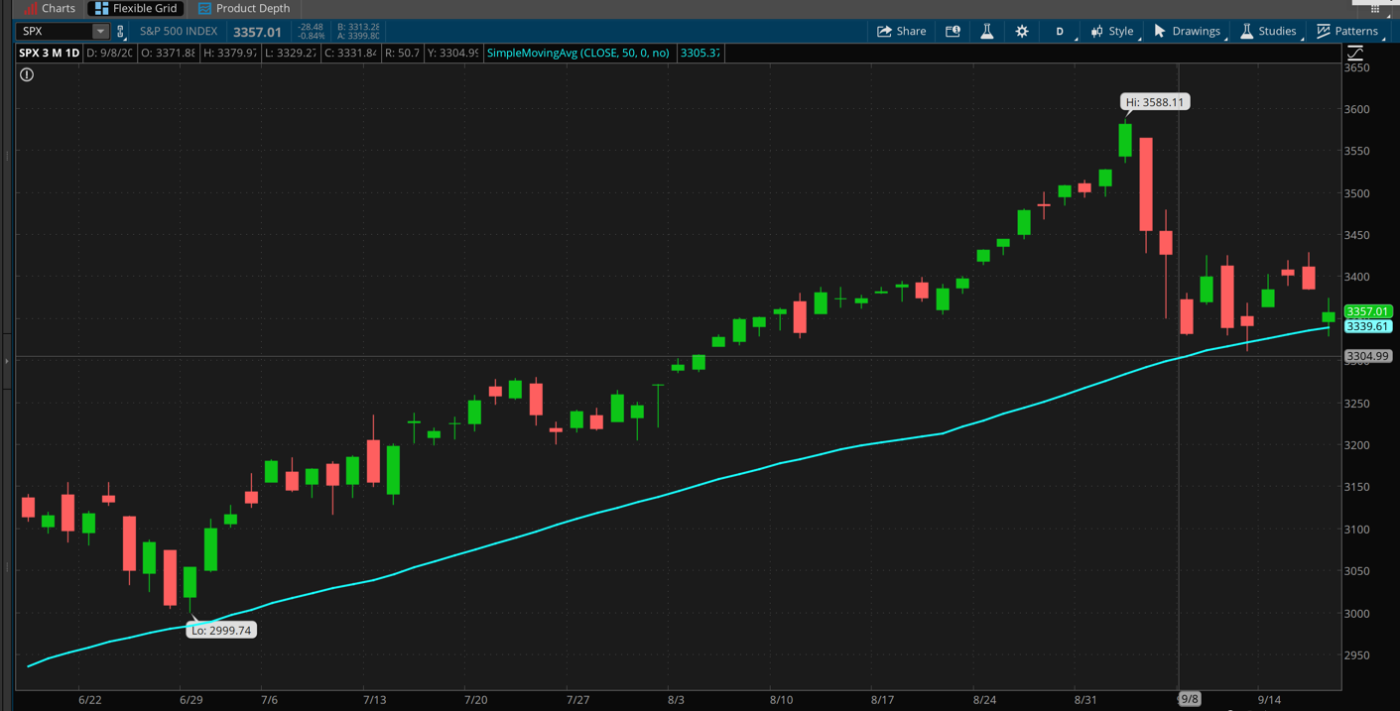
CHART OF THE DAY: GET DOWN AND GIVE ME 50! This three-month chart of the S&P 500 Index (SPX—candlestick) shows exactly how the 50-day moving average (blue line) continues to be a support point. The SPX has bounced off it several times all the way back to June, and it’s held together through several tests this month. The question is whether this can continue if the “mega-caps” keep showing weakness. Data Source: S&P Dow Jones Indices. Chart source: The thinkorswim® platform from TD Ameritrade. For illustrative purposes only. Past performance does not guarantee future results.
Week’s Stock Gyrations Making Your Head Spin? Better not Look at Crude. Stocks—particularly in the Tech sector—have certainly had their ups and (mostly) downs this week. But if you want a real head-spinner, check out the market in WTI Crude Oil futures (/CL). A week ago /CL was trading above $43 per barrel and yesterday it closed at $41. No great shakes—except that in between, crude took a detour down at $36, or 16% off the highs. What gives? In short, it’s a demand thing. And a supply thing.
After following the stock market down on a dampened economic outlook, the International Energy Agency threw petrol on the fire with its demand outlook that used terms like “weak recovery,” “treacherous path” and “risks elevated and skewed to the downside.” But then uncertainty spread to the supply side, first from weather risks in the Gulf of Mexico, and yesterday from OPEC, which announced its members and allies have fully complied with recent cuts—from 9.7 million barrels per day to 7.7 million—and that it would be extending a plan that offers compensation for full compliance. Equilibrium is that search for a market clearing price that matches supply and demand. In 2020, energy—like many asset classes—has been a tough one to pin down.
Drawing the Curtains on Q3: If you’re planning to trade over these final two weeks of the month (and quarter), beware of one possible factor that can crop up at these times. Often when quarters near an end, you see a lot of position squaring and heavier volume as institutional fund managers practice the ancient art of “window dressing” before sending quarterly reports to their clients.
Window-dressing means fund managers trying to improve the appearance of their portfolios by buying up high-flying stocks (think of how Tech performed this quarter) and selling the losers (Energy and Financials bring up the rear). These “artificial” moves can sometimes create increased market activity and a potential opportunity—both long and short trading positions—for traders to consider in the two weeks coming up.
Out of Whack: Sometimes a market relationship starts to get out of whack, for lack of a better term. At these times, it often makes sense for investors to take note. For instance, late last month volatility started ticking up even as stocks continued rising. That was a relationship that got out of gear (volatility typically falls when stocks rise) and within days, stocks took a tumble as the Nasdaq 100 (NDX) went through a 10% correction.
Another situation people had noticed around that time was the bifurcated nature of the market’s comeback from its March lows. By the end of August, S&P 500 growth stocks had outperformed S&P 500 value stocks by 35 percentage points, according to research firm CFRA. This was the widest gap since growth and value indices were created in the 1970s, exceeding even the peak of the “dot-com” period.
When you see something like that, it can summon up thoughts of the first President Bush declaring, “This will not stand!” And the pullback in growth that we’ve seen much of September followed quickly. Now the gap is down all the way back to its levels of 1999. Which is still wide. Anyone who remembers that year probably has memories of people bidding up obscure stocks simply because they had “.com” in their name. Because the growth/value gap remains so huge, CFRA warns investors to prepare for the possibility of additional pressure.
TD Ameritrade® commentary for educational purposes only. Member SIPC.
Photo by Alisina Elyasi on Unsplash
Edge Rankings
Price Trend
© 2025 Benzinga.com. Benzinga does not provide investment advice. All rights reserved.
Trade confidently with insights and alerts from analyst ratings, free reports and breaking news that affects the stocks you care about.

