


Nine of the ten largest debt raises ever completed for U.S. Cultivation & Retail companies were closed in 2021 and 2022. Over $4.3B of debt was sold over this period, far more than in any similar period in U.S. Cannabis history. Debt became the largest source of capital to the industry in 2022, and its percentage of total capital raised has increased further in 2023 YTD.

-
Corporate financial officers were justifiably reluctant to issue equity during the most severe drawdown the industry has faced. However, this has resulted in several companies with more debt than is sustainable on a long-term basis, particularly in the face of IRS rule 280e. Investors are paying close attention to the MSOs' ability to repay, extend, or refinance upcoming debt maturities.
-
This week's graph looks more deeply at MSO liquidity, including debt maturities. We utilized consensus analyst estimates for 2024 and 2025 EBITDA and Capex and 2024 taxes. We assumed that by 2025, rule 280e would be eliminated and calculated taxes at 27% of consensus pre-tax income estimates. 2024 Interest expense was estimated by annualizing 2023 2nd quarter interest expense. We reduced 2025 interest expense by 10% of each company's projected 2024 debt reduction. Company filings and FactSet provided debt maturity schedules.
-
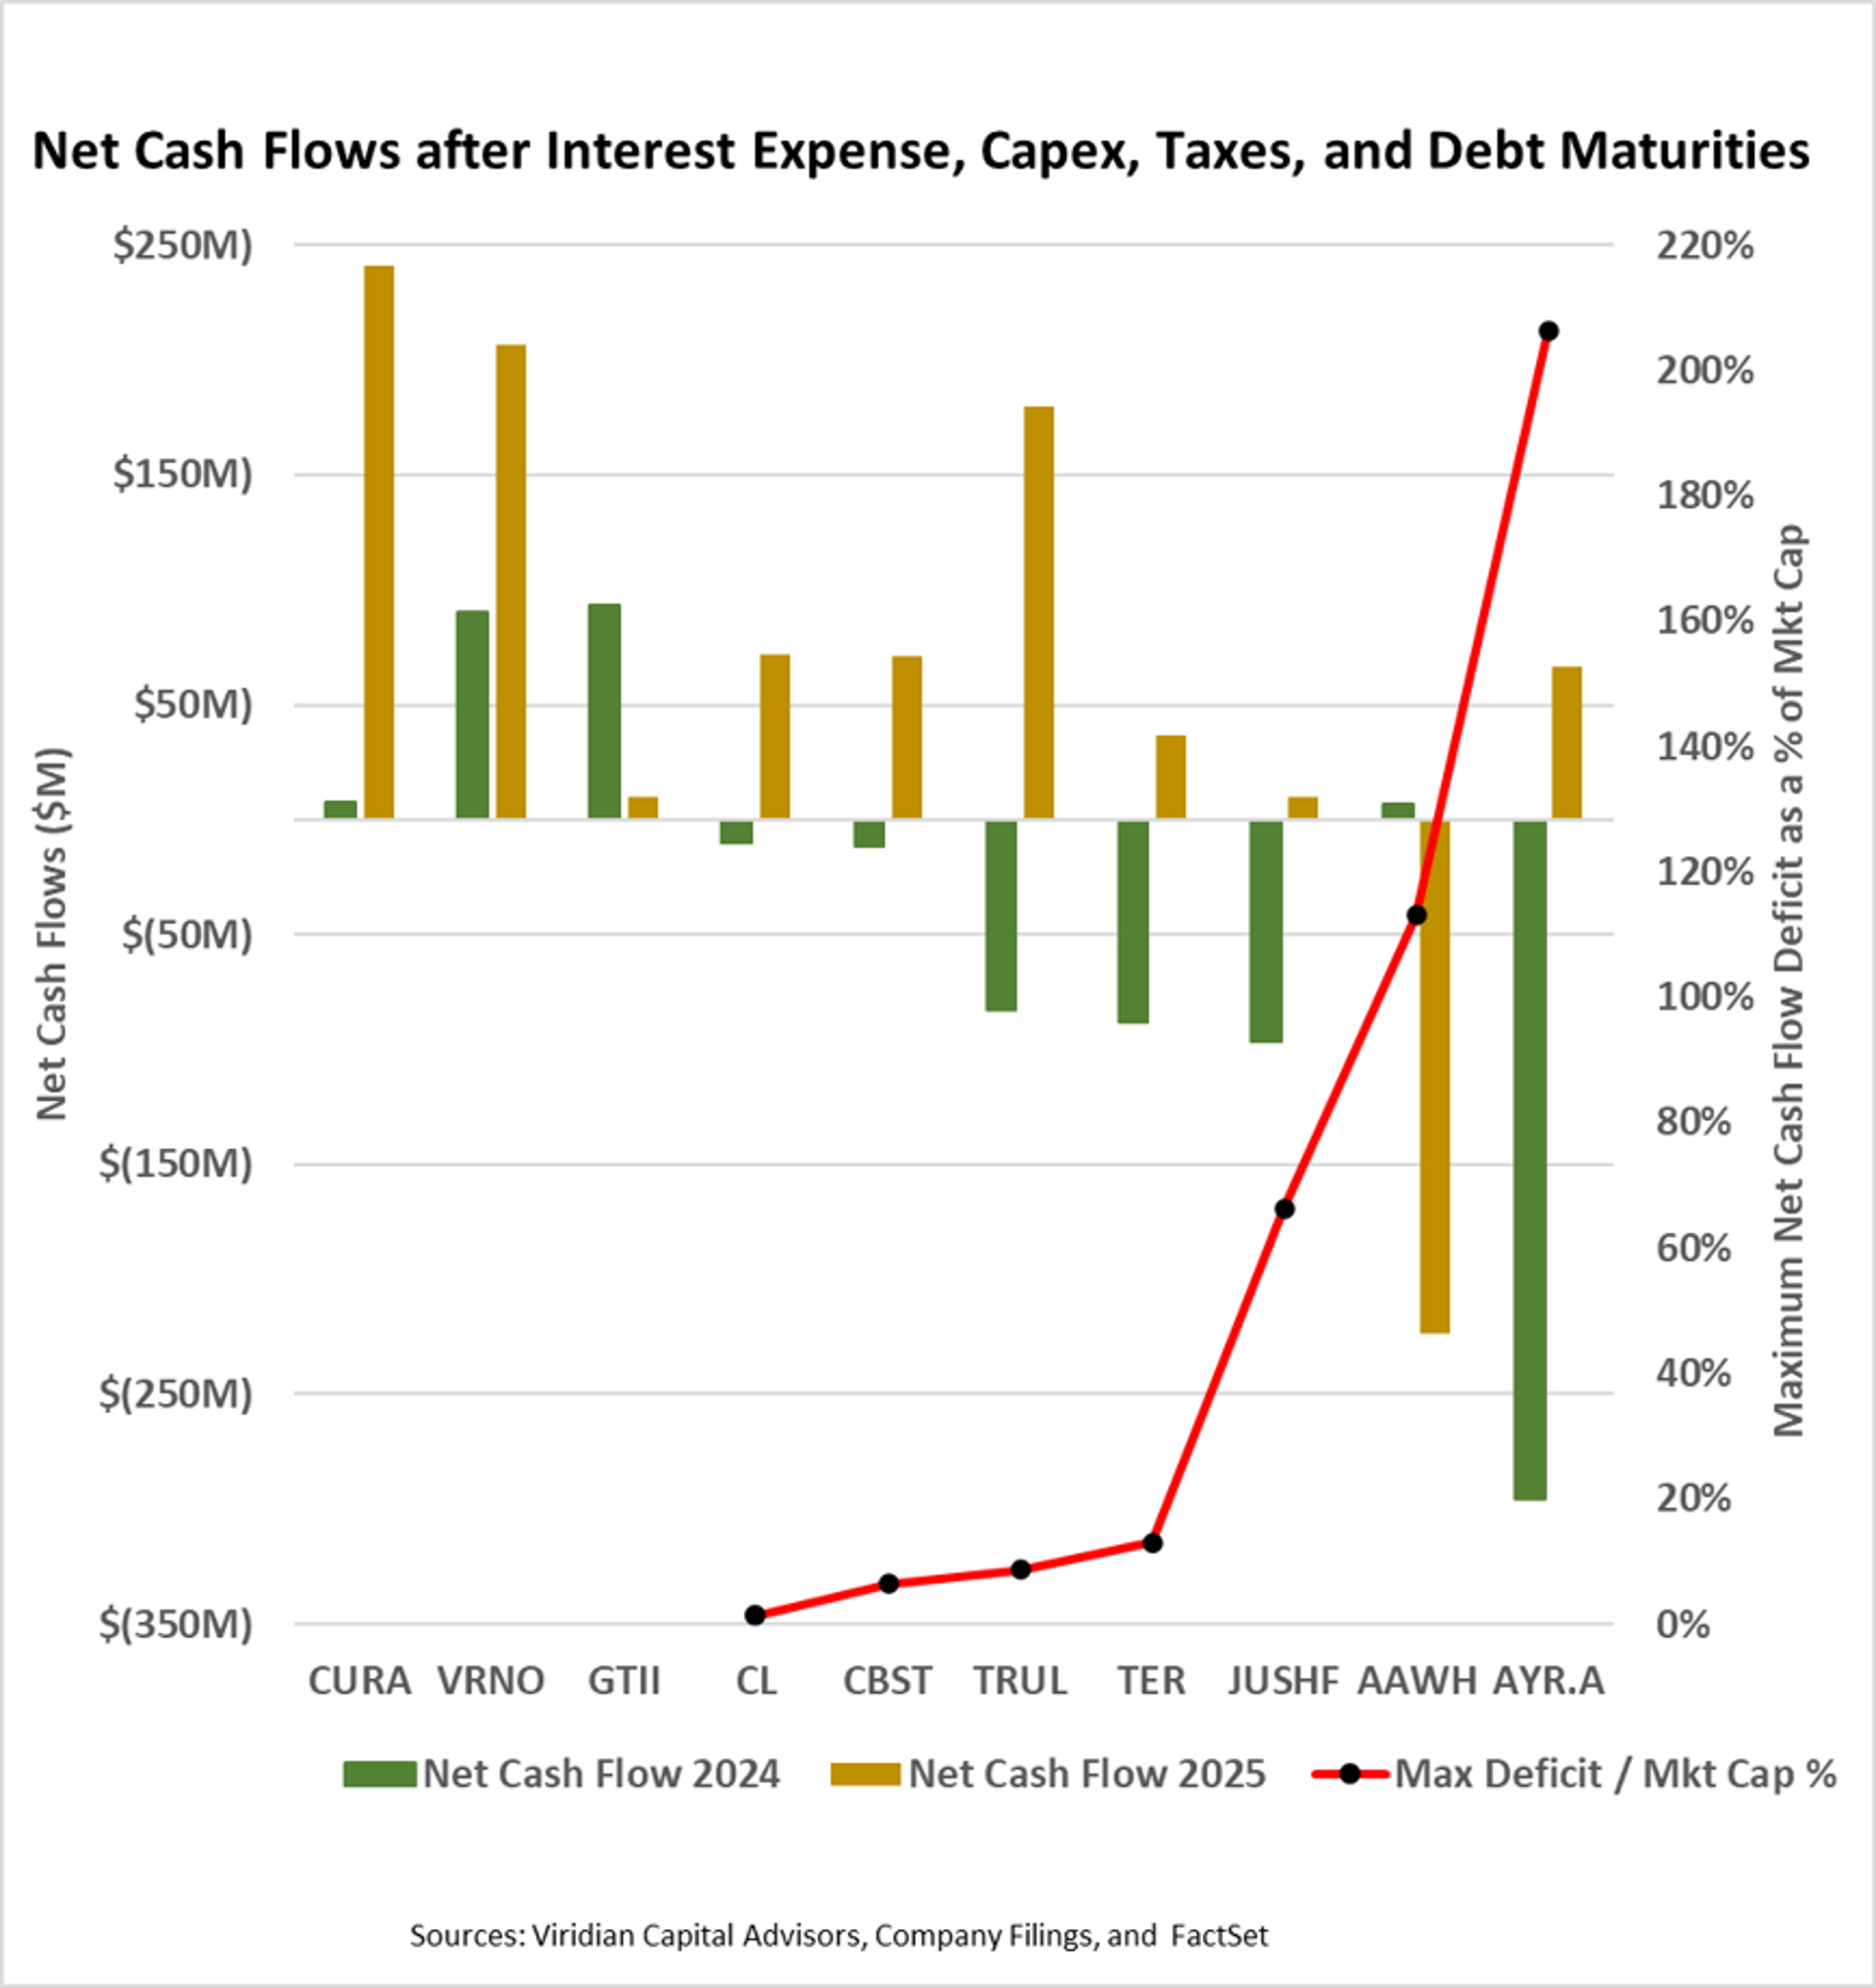
The graphs' bars represent net cash flows after interest, taxes, CAPEX, and debt maturities. The green bars show the 2024 net cash flow, while the brown bars show the 2025 net cash flow.
-
In 2024, Cresco CRLBF, TerrAscend TRSSF, and Jushi JUSHF were the only three companies to have slight cash flow deficits before debt maturities. All companies on the graph had solidly positive net cash flow before debt maturities in 2025.
-
The red line on the graph (measured on the right axis) shows the maximum net cash flow gap as a percent of current market capitalization. Three of the ten companies, including Curaleaf CURLF, Verano VRNOF, and Green Thumb GTBIF, have no projected shortfalls in either 2024 or 2025.
-
Cresco, Cannabist CBSTF, Trulieve TCNNF, and TerrAscend have maximum shortfalls after debt maturities of between 1% and 13% of market cap, levels we believe to be readily financeable.
-
Three of the companies on the right have somewhat more worrisome shortfalls. Jushi has a net cash flow shortfall of about $97M in 2024, representing about 66% of its market cap. Ascend AAWH has a projected shortfall of $224M in 2025, representing 113% of its market cap, and AYR Wellness AYRWF has a 2024 gap of $316M, representing 221% of its current market cap.
-
The three companies with significant deficits are likely to temporarily solve the problem by using fees and warrants to induce holders to extend maturities. Lenders are likely to be amenable as none want to face a default on such sizeable outstandings.
The Viridian Capital Chart of the Week highlights key investment, valuation and M&A trends taken from the Viridian Cannabis Deal Tracker.

The Viridian Cannabis Deal Tracker provides the market intelligence that cannabis companies, investors, and acquirers utilize to make informed decisions regarding capital allocation and M&A strategy. The Deal Tracker is a proprietary information service that monitors capital raise and M&A activity in the legal cannabis, CBD, and psychedelics industries. Each week the Tracker aggregates and analyzes all closed deals and segments each according to key metrics:
-
Deals by Industry Sector (To track the flow of capital and M&A Deals by one of 12 Sectors - from Cultivation to Brands to Software)
-
Deal Structure (Equity/Debt for Capital Raises, Cash/Stock/Earnout for M&A) Status of the company announcing the transaction (Public vs. Private)
-
Principals to the Transaction (Issuer/Investor/Lender/Acquirer) Key deal terms (Pricing and Valuation)
-
Key Deal Terms (Deal Size, Valuation, Pricing, Warrants, Cost of Capital)
-
Deals by Location of Issuer/Buyer/Seller (To Track the Flow of Capital and M&A Deals by State and Country)
-
Credit Ratings (Leverage and Liquidity Ratios)
Since its inception in 2015, the Viridian Cannabis Deal Tracker has tracked and analyzed more than 2,500 capital raises and 1,000 M&A transactions totaling over $50 billion in aggregate value.
The preceding article is from one of our external contributors. It does not represent the opinion of Benzinga and has not been edited.
© 2025 Benzinga.com. Benzinga does not provide investment advice. All rights reserved.
Trade confidently with insights and alerts from analyst ratings, free reports and breaking news that affects the stocks you care about.


Cannabis is evolving—don’t get left behind!
Curious about what’s next for the industry and how to stay ahead in today’s competitive market?
Join top executives, investors, and industry leaders at the Benzinga Cannabis Capital Conference in Chicago on June 9-10. Dive deep into market-shaping strategies, investment trends, and brand-building insights that will define the future of cannabis.
Secure your spot now before prices go up—this is where the biggest deals and connections happen!