


-
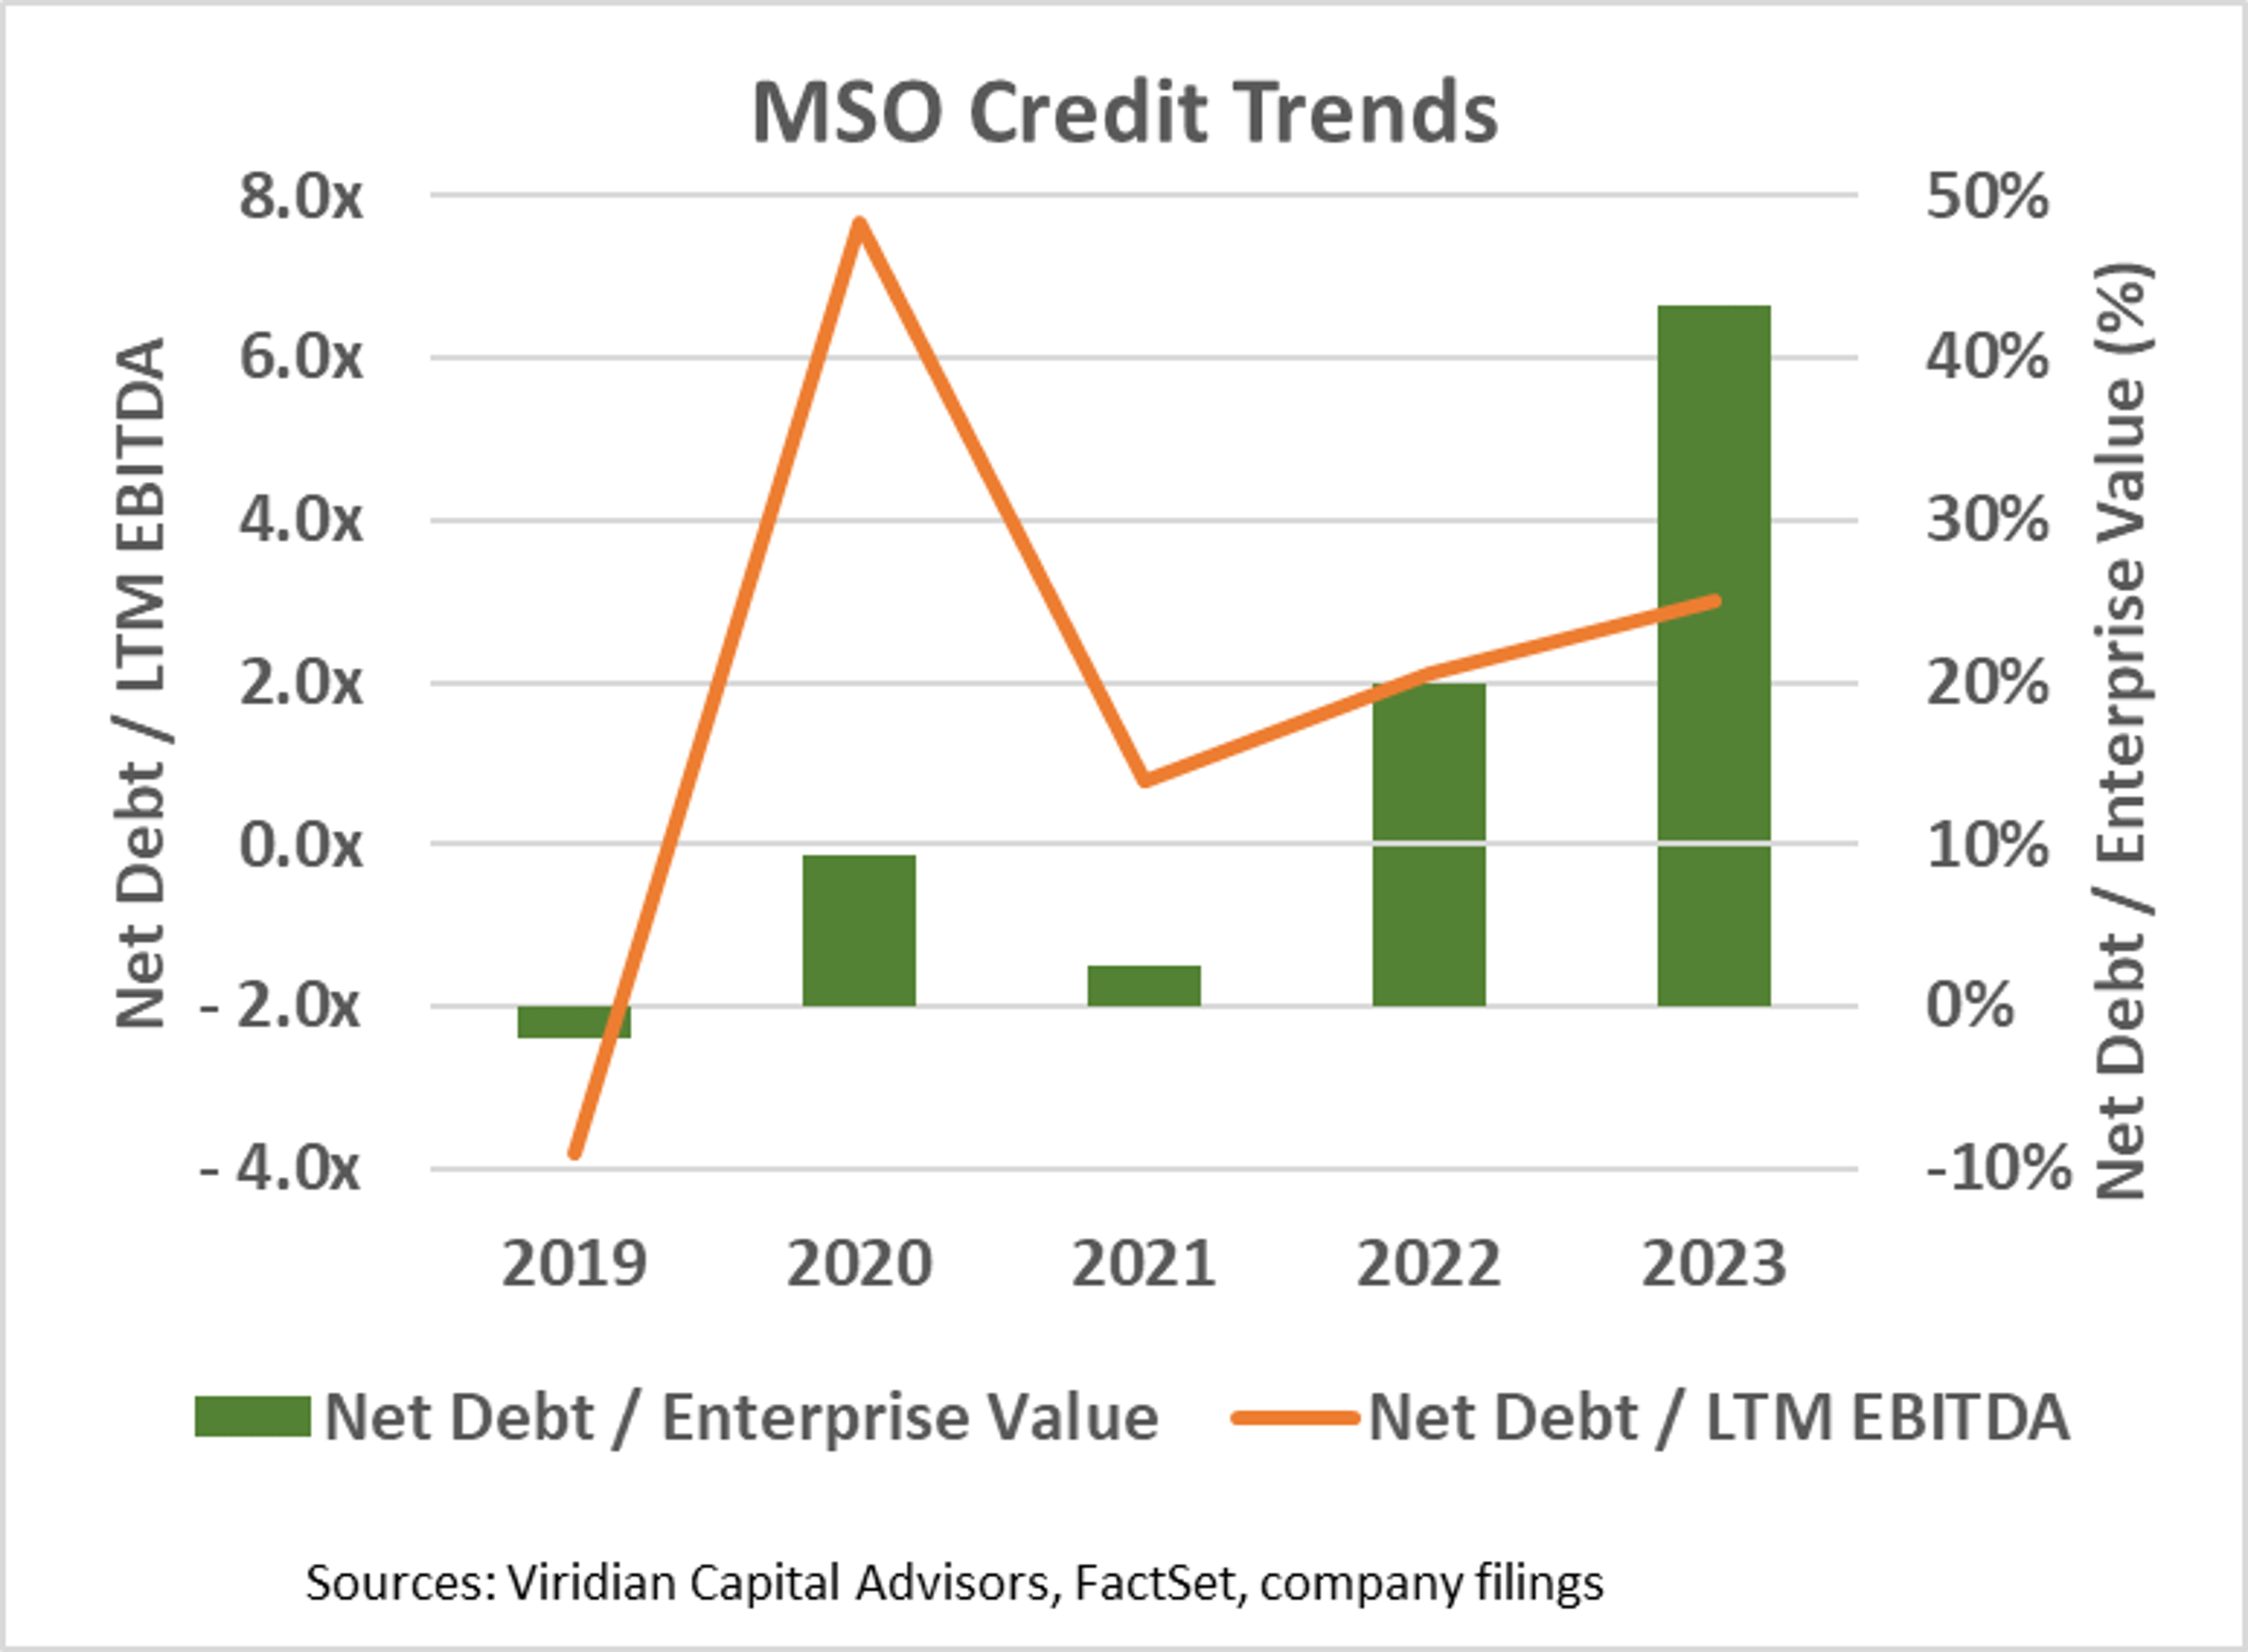
Aggregate net debt to LTM EBITDA for the top MSOs is now 3.0x with five of the eleven over 5x, arguably unsustainable in a 280e world.
-
The graph shows two essential indicators of cannabis company leverage and credit quality: Net debt/ LTM EBITDA and Net Debt/ Enterprise Value. The chart depicts Memorial Day figures using net debt and LTM EBITDA from the March quarter for each year.

-
The group of companies summed in the data includes Ascend AAWH, AYR AYRWF, Columbia Care CCHWF, Cresco CRLBF, Curaleaf CURLF, 4Front FFNTF, Green Thumb GTBIF, Jushi JUSHF, TerrAscend TRSSF, Trulieve TCNNF, and Verano VRNOF. Note: Ascend, AYR, 4Front, and Verano data was unavailable for the period ending 5/24/19.
-
The orange line (measured on the left axis) depicts Net Debt / LTM EBITDA. The green bars show Net Debt / Enterprise Value (measured on the right axis).
-
As of 5/24/19, the companies included in the chart had aggregate net cash of $178M, with only TerrAscend and Trulieve carrying net debt. In 2020 net debt rose to $938M, 7.7x LTM EBITDA of $122M. Despite this jump, net debt remained below 10% of enterprise value.
-
Soaring market caps and EBITDA made Memorial Day 2021 the peak of aggregate cannabis credit quality with Net Debt / LTM EBITDA of .77x and Net Debt / Enterprise Value of 2%.
-
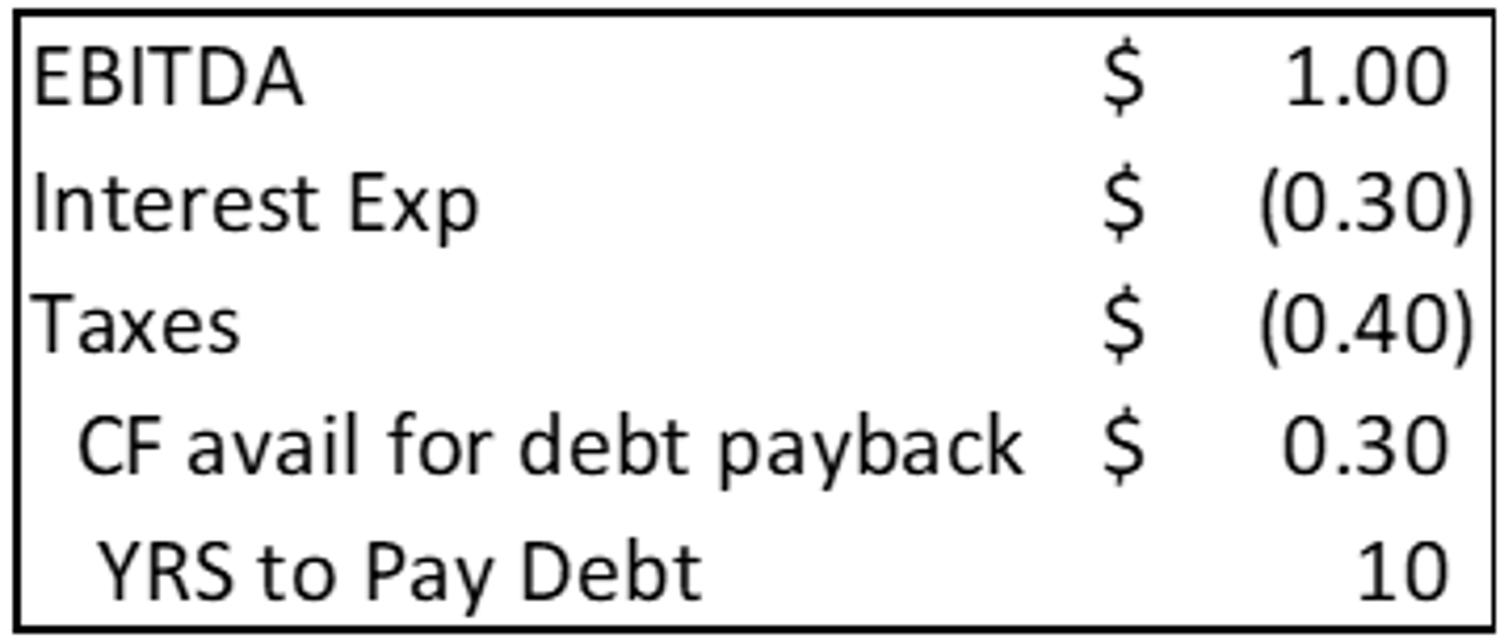
Aggregate credit quality has deteriorated over the last two years. With the equity financing window essentially shut, MSOs have increasingly financed with debt while inflation and wholesale price pressures have stalled EBITDA growth. Net Debt is up 31% to $5.4B from $4.1B last year, while LTM EBITDA is down 7% to $1.8B from $1.94B last year. Net Debt/ LTM EBITDA is now 3.0x for the group, which doesn’t appear high in the context of leveraged finance; however, 280e substantially impacts the amount of debt that is supportable by plant-touching enterprises. Assuming 10% interest rates and 40% taxes on EBITDA (both of which seem low), a 3x Debt/ EBITDA implies a nearly 10-year debt payback period.

-
Some of the group members are much better credits than others. Green Thumb and Verano have less than two turns of net debt, while Jushi and 4Front have over 10x. Still, five of the eleven companies now have net debt of over 5x LTM EBITDA.
-
What is the answer? A re-equitization is needed. However, the group is now trading at an enterprise value of only $12B, down from $38B on Memorial Day 2021, and EV / LTM EBITDA is 6.8x compared to well over 20x in 2021. Given its growth prospects, the industry is incredibly cheap, but the issue is the catalyst. SAFE? Rescheduling/ Descheduling? 280e reform? None of them seem tangibly close. In the near term, debt remains the only game in town, but there are limits. Careful credit analysis is more critical in cannabis investing than ever.

The Viridian Capital Chart of the Week highlights key investment, valuation and M&A trends taken from the Viridian Cannabis Deal Tracker.
The Viridian Cannabis Deal Tracker provides the market intelligence that cannabis companies, investors, and acquirers utilize to make informed decisions regarding capital allocation and M&A strategy. The Deal Tracker is a proprietary information service that monitors capital raise and M&A activity in the legal cannabis, CBD, and psychedelics industries. Each week the Tracker aggregates and analyzes all closed deals and segments each according to key metrics:
-
Deals by Industry Sector (To track the flow of capital and M&A Deals by one of 12 Sectors - from Cultivation to Brands to Software)
-
Deal Structure (Equity/Debt for Capital Raises, Cash/Stock/Earnout for M&A) Status of the company announcing the transaction (Public vs. Private)
-
Principals to the Transaction (Issuer/Investor/Lender/Acquirer) Key deal terms (Pricing and Valuation)
-
Key Deal Terms (Deal Size, Valuation, Pricing, Warrants, Cost of Capital)
-
Deals by Location of Issuer/Buyer/Seller (To Track the Flow of Capital and M&A Deals by State and Country)
-
Credit Ratings (Leverage and Liquidity Ratios)
Since its inception in 2015, the Viridian Cannabis Deal Tracker has tracked and analyzed more than 2,500 capital raises and 1,000 M&A transactions totaling over $50 billion in aggregate value.
© 2025 Benzinga.com. Benzinga does not provide investment advice. All rights reserved.
Trade confidently with insights and alerts from analyst ratings, free reports and breaking news that affects the stocks you care about.


Cannabis is evolving—don’t get left behind!
Curious about what’s next for the industry and how to stay ahead in today’s competitive market?
Join top executives, investors, and industry leaders at the Benzinga Cannabis Capital Conference in Chicago on June 9-10. Dive deep into market-shaping strategies, investment trends, and brand-building insights that will define the future of cannabis.
Secure your spot now before prices go up—this is where the biggest deals and connections happen!