The Forward Guidance Trap
We did not expect a 50bp increase in the FOMC median policy forecast for ‘24 and ‘25, nor did we expect them to forecast tighter policy in ‘25 and ‘26 as measured by real policy rates from 2.3% at year-end (YE) ‘23 to 2.6% at YE24 and 2.7% at YE25. While some may want to dismiss these forecasts in the spirit of the great philosopher Yogi Berra’s quip, ‘It's tough to make predictions, especially about the future’, we suspect these were not independent forecasts, instead they were intended as forward guidance. The FOMC, cheered on by the academic intelligentsia that supports them, views forward guidance as a powerful policy tool. As a market participant who watched the evolution from Volcker and Greenspan obfuscation to Bernanke’s adoption of forward guidance, we view this policy tool as largely counterproductive due to reduced flexibility and increased interference in private sector price determination, which mostly leads to capital misallocation. As one trader told us, it’s a straitjacket. To be clear, we do not believe the Fed will realize their forecast for a 5+% policy rate for the next 15 months, instead they will pivot, but only when they break something first. This week’s note works through our unstable equilibrium framework, paths to yield curve disinversion, and a significant downgrade of our market outlook.
The implications of the Fed’s forward guidance for our markets outlook for the balance of the year, assuming the coming round of Fed speak doesn’t back track, is significant. The first post-FOMC speech, delivered at a community bankers conference by former community banker Bowman, offered no hint of a reversal, she wants to hike further, and gave no indication that the Fed is concerned about the impact of the deeply inverted yield curve on the supply of credit. In essence, we expected the unstable equilibrium, between strength in the household and large nonfinancial corporates due to a lack of rate sensitivity on the one hand, and weakness in the banking system impairing the credit channel to the real estate, highly levered companies and small businesses, on the other, to persist through the balance of the year. We expected increasing earnings revisions, and an improved monetary policy outlook, to offset a deterioration in the growth outlook. The Summary of Expectations forecasts just knocked a key leg of the stool out from under our tactical outlook.
As we detailed last week in last week’s note, Banks Selling What They Can, the risk that clients we met with in our trip to NYC were most focused on was a bear steepening of the Treasury Curve (longer rates leading a sell off). Even with a dovish monetary policy outlook, clients were concerned that the market would struggle to absorb increased Treasury supply attributable to our historically profligate fiscal policy. In Where Did Secretary Yellen's Customers Go, we detailed the loss of the primary buyers of USTs — the Fed, banks and foreign buyers from Asia in particular. We dug a bit deeper last week into the banking system motivation for reducing Treasury holdings. This week’s housing starts number confirmed anecdotal client commentary, multifamily starts dropped 26.3% in July, and are 43.1% below their pre-Silicon Valley Bank collapse February reading.
With 1.01 million under construction, the largest spread between units under construction and starts in this series, there are two looming issues. First, as projects are completed, they will need to be refinanced from term construction loans originated with a zero-base policy rate, now 5.25% and rents growing as fast as 16% (Zillow Observed rent Index February ‘22 peak), now 3.1%., to multifamily loans. Given the massive deterioration in these crucial metrics, even if loan-to-value (LTV) ratios were low, the banks are likely to wind up with the keys to a lot of buildings. Second, while the backlog will put additional pressure on rents in ‘24 and ‘25, the drop in supply, combined with the worst affordability readings for homebuyers since 1985, is likely to result in structurally higher rental rate growth through the balance of the ‘20s. This set against the backdrop of the highest household formation numbers since the ‘70s, a condition that is a function of ‘21 mortgage-backed securities and Treasury purchases that drove the spread between mortgages to historic lows thereby attracting financial buyers of real estate and the retail mortgage rates to all-time lows, a bonanza for households. The result was a .97 correlation of the 20 cities in the Case Shiller Index for 10 months, compelling evidence that Fed asset purchases were the primary catalyst for the 46% increase in the composite index during the pandemic.
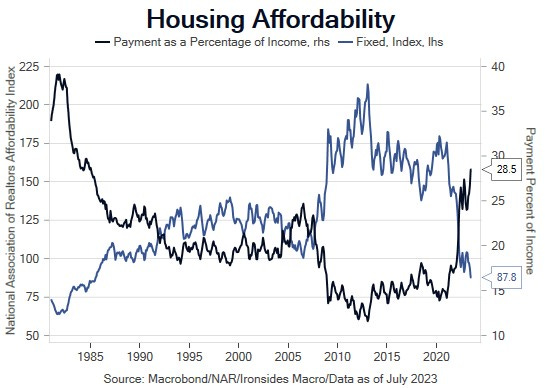
Figure 1: Monetary policy has degraded housing affordability to the worst levels since the mid ‘80s. This is unfortunate given household formations increasing to the best levels in decades due to demographics.
© 2025 Benzinga.com. Benzinga does not provide investment advice. All rights reserved.
Trade confidently with insights and alerts from analyst ratings, free reports and breaking news that affects the stocks you care about.

