
The S&P 500 index reached the significant threshold of 5,000 points just moments before the close of trading on Thursday, Feb. 8, extending its run to new all-time highs. Yet with this remarkable surge in the market-cap weighted index, there are cautionary signals when comparing the index to its equal-weight counterpart.
Over the last year, the performance of the S&P 500 index, tracked by the SPDR S&P 500 ETF Trust (NYSE:SPY), has surged by 21%.
In stark contrast, the Invesco S&P 500 Equal Weight ETF (NYSE:RSP) has only seen a 4% return in the same period, significantly trailing its cap-weighted counterpart.
The relative ratio between the two indices has reached levels not seen since September 2020. The forward price-to-earnings ratio for the cap-weighted index stands at 21, making it 24% more expensive than the valuation of the equal-weight index.

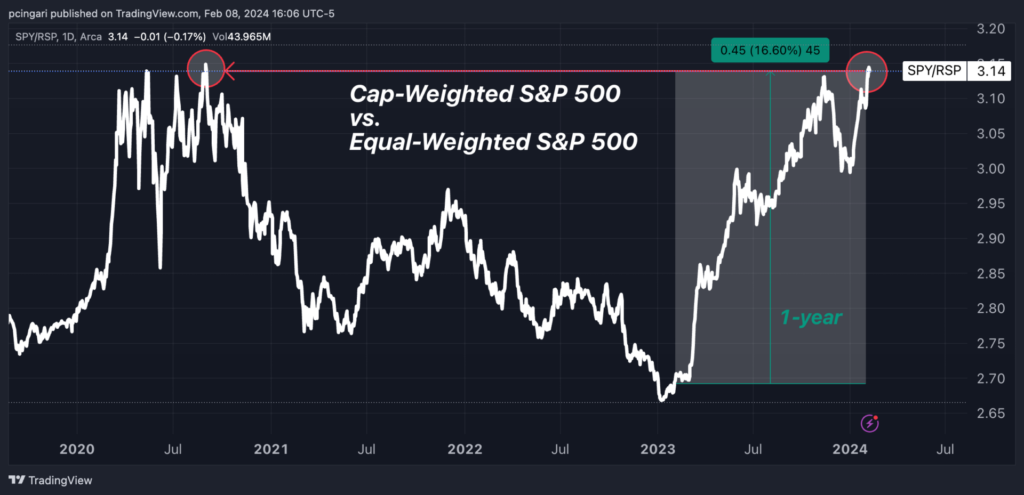
The concentration of weight in the Magnificent Seven within the S&P 500 Index plays a crucial role in explaining the stark 17-percentage-point difference in performance over the last year between the two indices.
The combined weight of Apple Inc. (NASDAQ:AAPL), Microsoft Corp. (NYSE:MSFT), Alphabet Inc. (NASDAQ:GOOG) (NASDAQ:GOOGL), Amazon Inc. (NASDAQ:AMZN), Meta Platforms Inc. (NASDAQ:META), NVIDIA Corp. (NASDAQ:NVDA) and Tesla, Inc. (NASDAQ:TSLA) in the cap-weighted S&P 500 has surged to 29.3% of the overall index.
Together, these seven stocks have soared by nearly 80% over the last year. Remarkably, these heavyweights alone have contributed 64% of the S&P 500’s returns during the same period.
S&P 500 Performance Contributions Over The Last Year
| Company | Weight | Return | Contribution |
|---|---|---|---|
| Microsoft Corporation | 7.24% | 56.64% | +3.25 pp |
| Apple Inc. | 6.65% | 24.68% | +1.64 pp |
| NVIDIA Corporation | 4.05% | 213.76% | +3.43 pp |
| Amazon.com, Inc. | 3.70% | 69.81% | +1.89 pp |
| Meta Platforms, Inc. | 2.42% | 156.28% | +1.84 pp |
| Alphabet Inc. (Class A) | 2.05% | 46.88% | +0.81 pp |
| Alphabet Inc. (Class C) | 1.74% | 47.26% | +0.69 pp |
| Berkshire Hathaway Inc. (NYSE:BRK) | 1.72% | 28.85% | +0.48 pp |
| Eli Lilly and Company (NYSE:LLY) | 1.35% | 117.94% | +0.91 pp |
| Broadcom Inc. (NASDAQ:AVGO) | 1.29% | 116.71% | +0.86 pp |
| Tesla, Inc. | 1.23% | -5.84% | -0.09 pp |
| Security Name | Weight | Average Return | Total Contribution |
|---|---|---|---|
| Magnificent Seven | 29.14% | 77% | +12.08 pp |
Despite their combined weight amounting to approximately 1.5% in the equal-weighted index, their overall performance contribution doesn’t even reach 1 percentage point.
As the S&P 500 index celebrates its monumental leap to the 5,000-point milestone, investors and market observers are prompted to look beyond the surface of these record-breaking numbers.
Read also: Muddy Waters Shorts Fairfax Financial Holdings: ‘Not The Berkshire Hathaway Of Canada’
© 2025 Benzinga.com. Benzinga does not provide investment advice. All rights reserved.