


Stocks rallied last week with the S&P 500 rising 1.9% to close at 5,222.68. The index is now up 9.5% year to date and up 46% from its October 12, 2022 closing low of 3,577.03.
It was one of the quieter weeks for economic data, earnings announcements, and other major market-moving events.
So, in lieu of riffing off a news event, here’s a bunch of charts that caught my eye in recent weeks:


The Stock Market Likes The Absence Of News
From BofA: “Historically, quiet weeks have been the best weeks for stocks. No news is good news.“
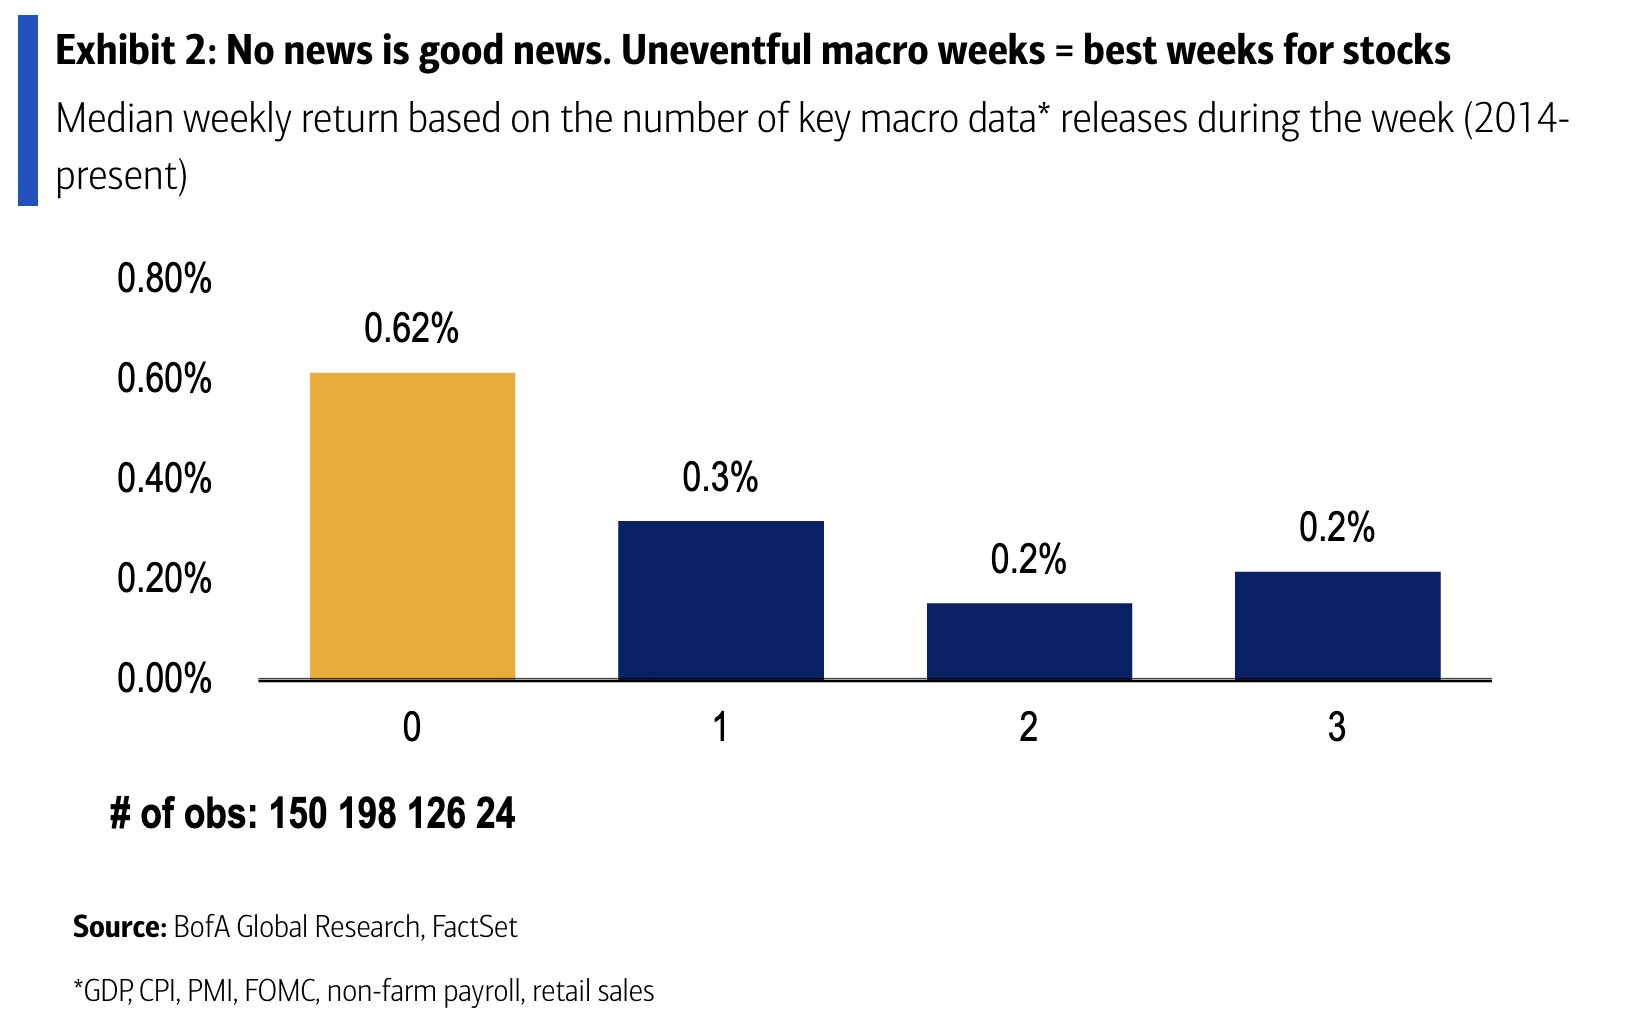
(Source: BofA)
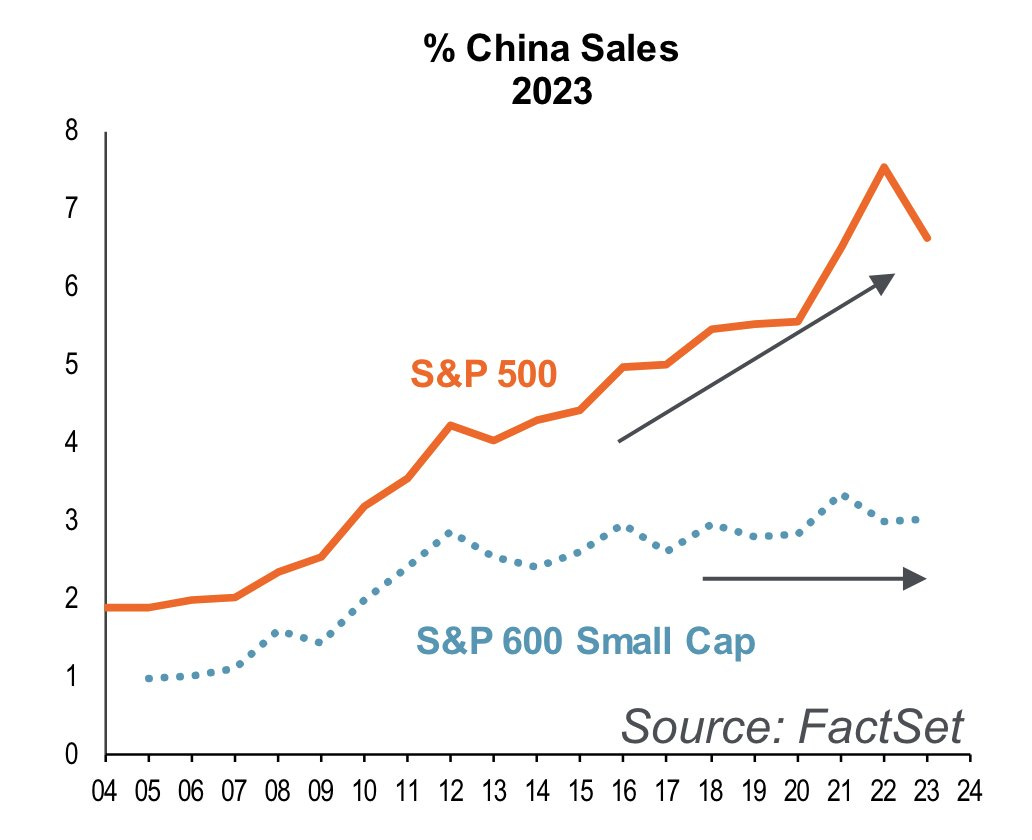
The S&P 500 Gets You Exposure To China
From Piper Sandler (HT Blake Millard): “S&P large caps have near-record exposure to a China that is wobbly economically, with an increasingly authoritarian Heavy Hand of regulation.“
S&P 500 companies employ a lot of people
From Apollo Global’s Torsten Slok: “Total global employment in the S&P 500 companies is 29 million, and total employment in the US economy is 158 million, see chart below. Put differently, more than 80% of total employment in the US economy is outside the S&P 500 companies.“
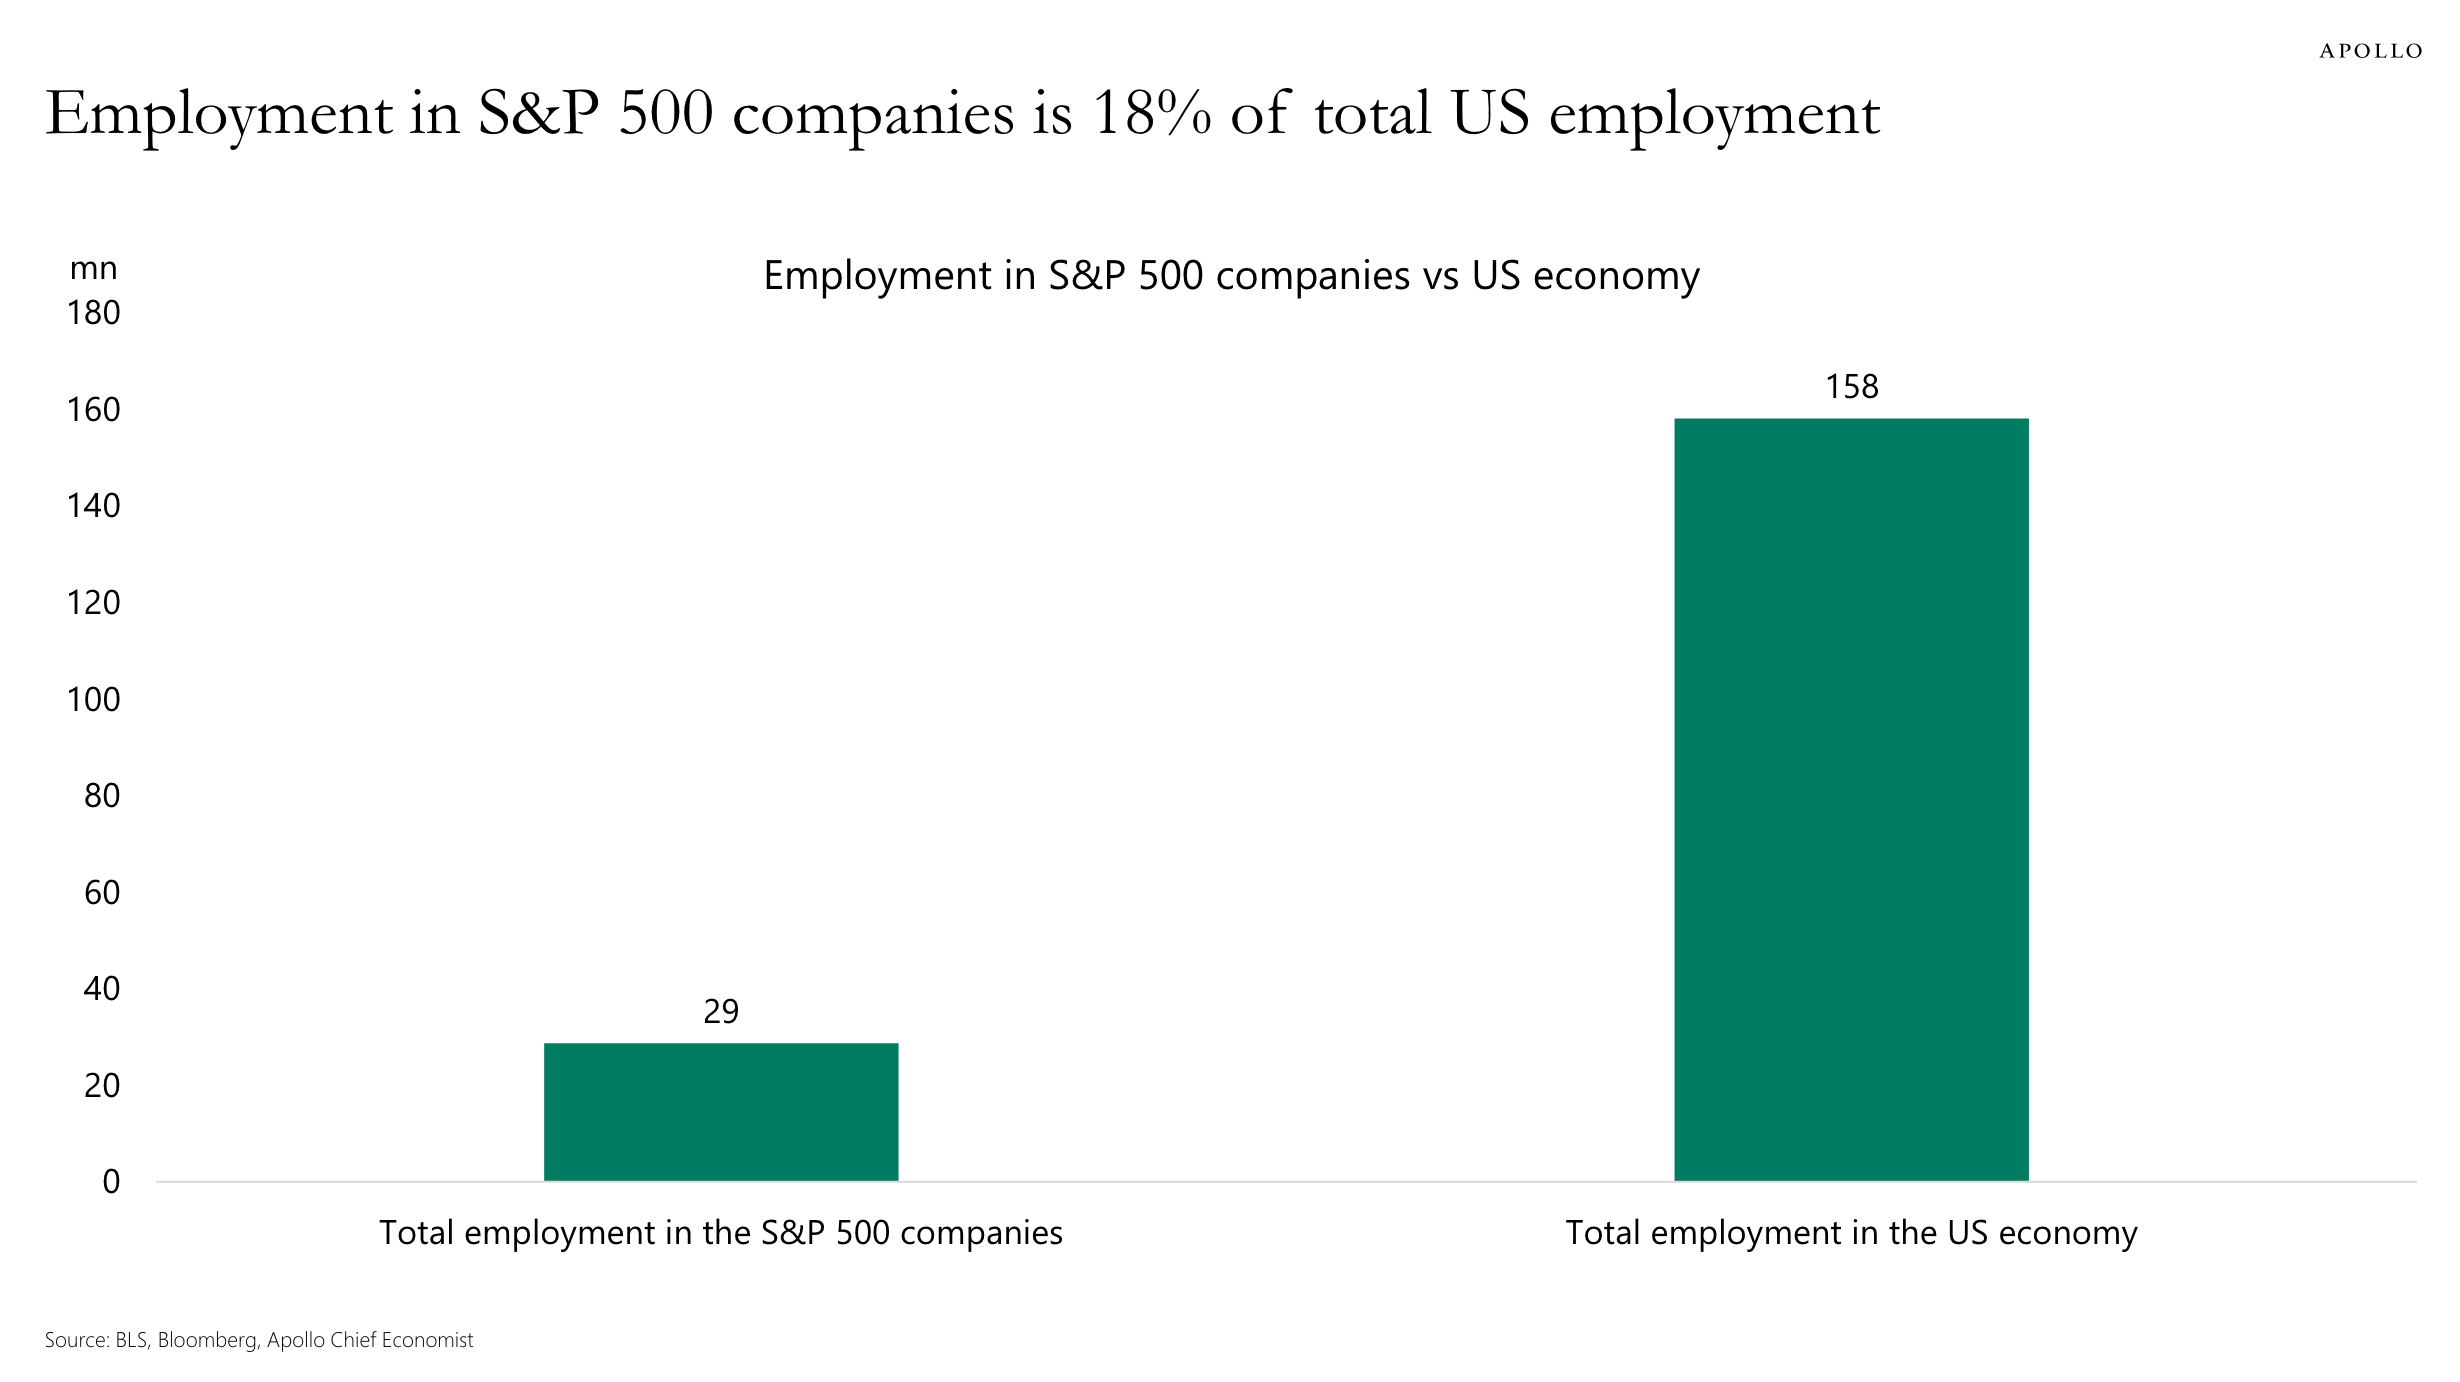
(Source: Apollo Global)
It’s worth noting that S&P 500 companies do a lot of business outside of the U.S., which means many of those 29 million employees aren’t based in the U.S.
Higher Rates Don’t Spell Doom For Stocks
From Ritholtz Wealth Management’s Ben Carlson: “The relationship between interest rates and stock market performance is murky at best… It’s certainly not a one-to-one correlation where higher rates lead to lower returns. The lowest returns have come in the 3-4% and 7-8% ranges. The best returns have come when rates are 2% or less, which makes sense when you consider rates were only that low during two of the biggest crises this century (the GFC and Covid). Look at the 4% to 6% range, which is where we are now. The returns have been pretty good. Maybe one of the reasons for this is because the average 10 year yield since 1950 is 5.4% (the median is 4.7%). Rates like this occur during normal times (if such a thing exists).“
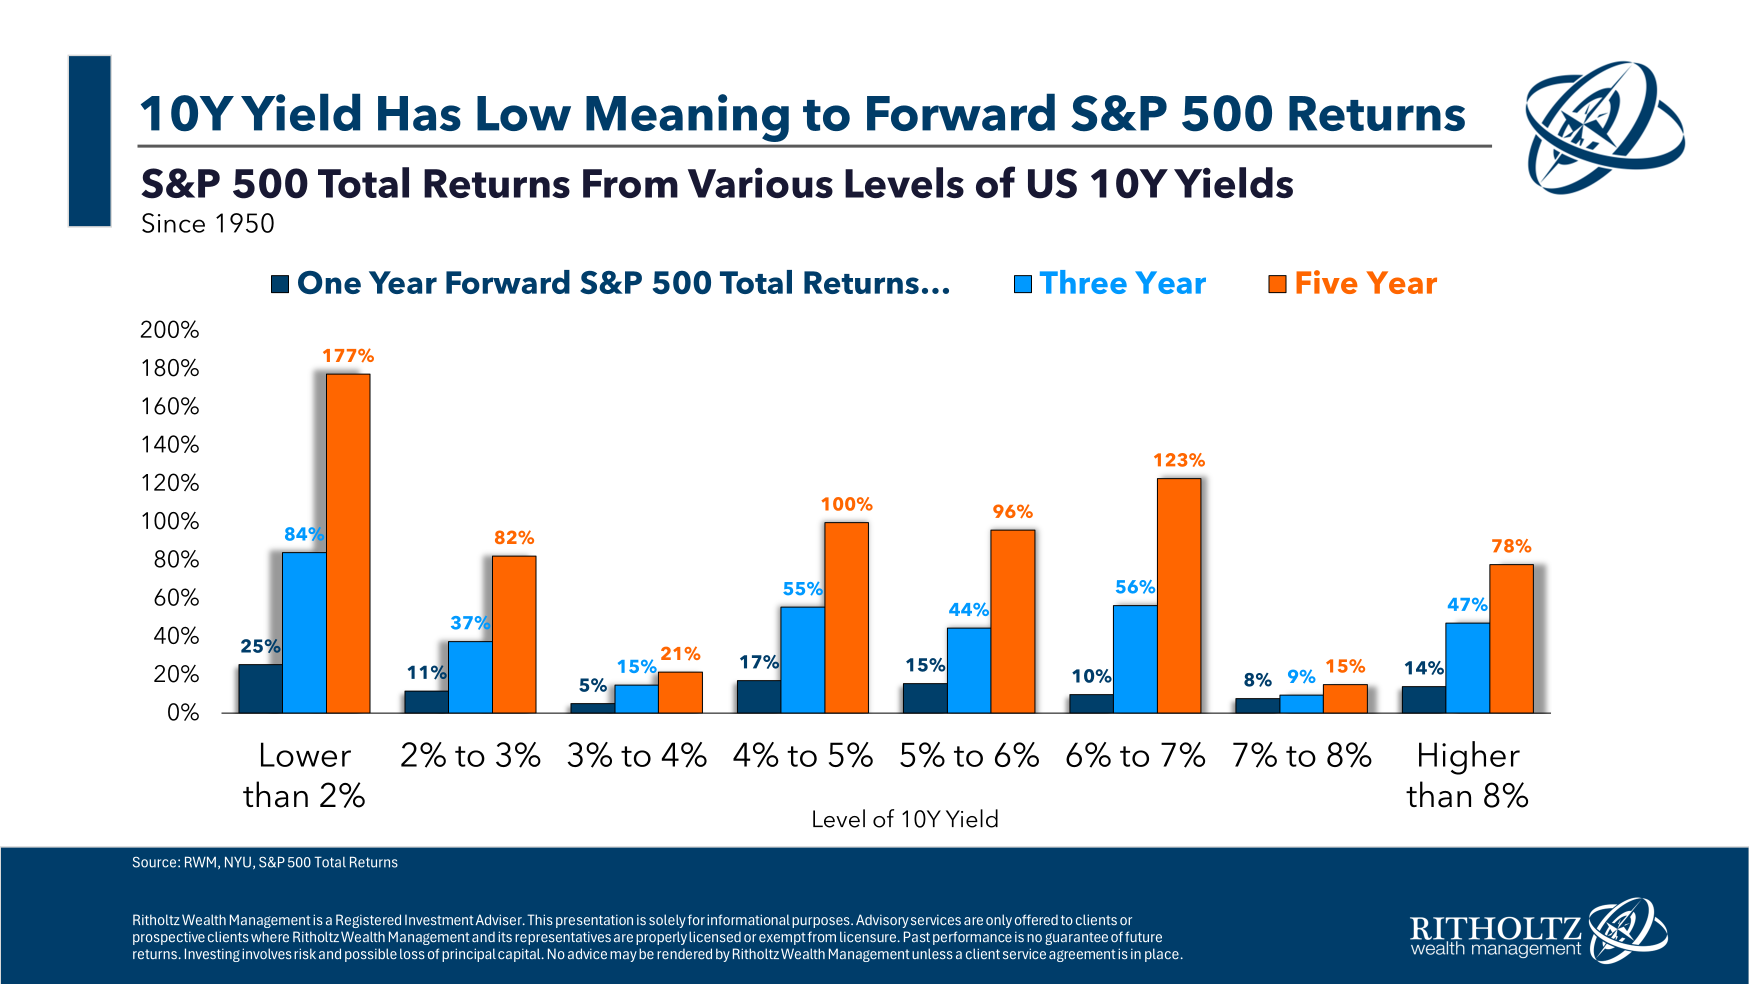
(Source: Ben Carlson)
Interest Expenses Remain Cool
Despite tight monetary policy and elevated interest rates, corporate net interest costs remain low. This is thanks to a combination of debt that’s largely locked in low rates and elevated cash balances earning more interest.

(Source: JPMorgan Asset Management)
Profit Margins Are Holding Up
From Carson Group’s Ryan Detrick: “Yes, profit margins are improving due to cost-cutting, but this will likely create a leaner and more agile corporate America the second half of this year. We’ve been told for what feels like years now that profit margins have only one way to go and that is lower, but the opposite continues to happen. Improving profits and profit margins supported by continued economic growth next year would provide a strong tailwind for equities.“

(Source: Carson Group)
The Near-Term Earnings Outlook Is Improving
From FactSet (emphasis added): “In a typical quarter, analysts usually reduce earnings estimates during the first month of a quarter. During the past five years (20 quarters), the average decline in the bottom-up EPS estimate during the first month of a quarter has been 1.9%. During the past ten years, (40 quarters), the average decline in the bottom-up EPS estimate during the first month of a quarter has been 1.8%. During the past fifteen years, (60 quarters), the average decline in the bottom-up EPS estimate during the first month of a quarter has been 1.5%. During the past 20 years (80 quarters), the average decline in the bottom-up EPS estimate during the first month of a quarter has been 1.8%. In fact, the second quarter marked the first time that the bottom-up EPS estimate increased during the first month of a quarter since Q4 2021 (+0.3%).”

(Source: FactSet)
It probably helps that most companies beat estimates for Q1 earnings.

(Source: S&P Dow Jones Indices)
The Magnificent Earnings Story Is Shifting
The “Magnificent 7” stocks — Microsoft MSFT, Apple MSFT, Alphabet GOOGL, NVIDIA NVDA, Amazon AMZN, Meta Platforms META, and Tesla TSLA — have led the market higher thanks to outsized earnings growth. However, earnings growth is expected to cool for those names as they heat up for the other 493 stocks of the S&P 500.

RBC
Stock Buyback Activity Is Elevated
Here’s Deutsche Bank on buyback announcements: “Buyback announcements booming, and not just from mega-cap tech companies. With earnings season in full swing, S&P 500 buybacks announcements also spiked to over $130bn just this week, taking the total so far in this earnings season to $262bn. While the high-profile announcements from Apple and Alphabet have garnered the most attention, we note that announcements from other companies this earnings season have also totaled a solid $82bn.“

(Source: Deutsche Bank)
From BofA on buyback activity: “Corp. client buybacks decelerated slightly vs. the prior week but are tracking above typical seasonal levels at this time for the ninth consecutive week. YTD, corp. client buybacks as a percentage of S&P 500 market cap (0.40%) are above '23 highs (0.33%) at this time.“

(Source: BofA)
Recession Chatter Is Receding
According to The Wall Street Journal’s Justin Lahart: “Among companies in the S&P 500, the term ‘recession’ showed up in just 100 transcripts of earnings calls, investor events and conferences recorded in the first quarter, according to FactSet. That was down from 302 in the first quarter of 2023, and the fewest in two years.“
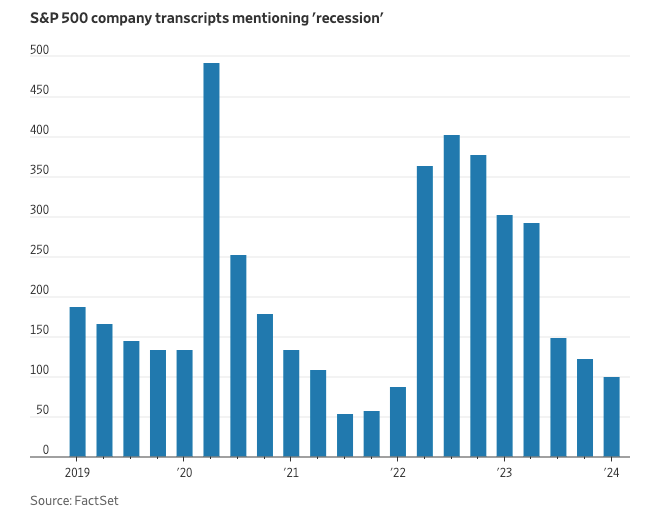
WSJ
Stocks Usually Go Up Us
JPMorgan analysts reviewed the performance of the S&P 500 under various U.S. Presidents since 1945. In most cases, the market trended higher. But also in most cases, the market experienced double digit max drawdowns.

(Source: JPMorgan)
What Past Election Cycles Show
From Oppenheimer’s Ari Wald: “The S&P 500 has closely followed its typical seasonal trajectory in recent years. Looking ahead, we believe seasonals indicate the potential for market consolidation should be used opportunistically to buy stocks ahead of seasonal tailwinds between June and August.“

(Source: Oppenheimer)
An Average Bull Market
From Fidelity’s Jurrien Timmer: “The cyclical bull market is 19 months old, with a gain of 46% (down from high of 50% in March). It’s modest, but in line with previous soft landings.“

(Source: @TimmerFidelity)
Expect Bumps In The Road On The Way Up
From Truist’s Keith Lerner: “Since March 9, 2009, where stocks bottomed following the Global Financial Crisis, we count 28 previous pullbacks of at least 5% for the S&P 500. Impressively, despite these setbacks, stocks are up 644% on a price basis and 900% including dividends over that entire period.“

(Source: Truist)
“Sell In May And Go Away” Is No Sure Thing
… or so the old Wall Street saying goes. The idea is that stocks underperform from May through August. But does it work as a trade?
The chart below from Deutsche bank…
…shows the strategy since 1973 in the U.S. based on selling at the end of April and reinvesting at the end of August whilst being fully invested at all other times. … our chart shows;
A simple sell equities strategy and retreat to cash (no interest) over the period
Staying with a buy-and-hold equity strategy all year round
Sell equities, buy US Treasuries for the 4-month summer period
Overall, the seasonal strategy wouldn’t have worked well, especially if you stayed out of all assets. Had you switched into Treasuries the trade would have slightly outperformed but with the buy and hold strategy having caught up in recent years.

At TKer, we’re not crazy about going all in on short-term trades.
A version of this post was originaly published on Tker.co.
Edge Rankings
Price Trend
© 2025 Benzinga.com. Benzinga does not provide investment advice. All rights reserved.
Trade confidently with insights and alerts from analyst ratings, free reports and breaking news that affects the stocks you care about.

