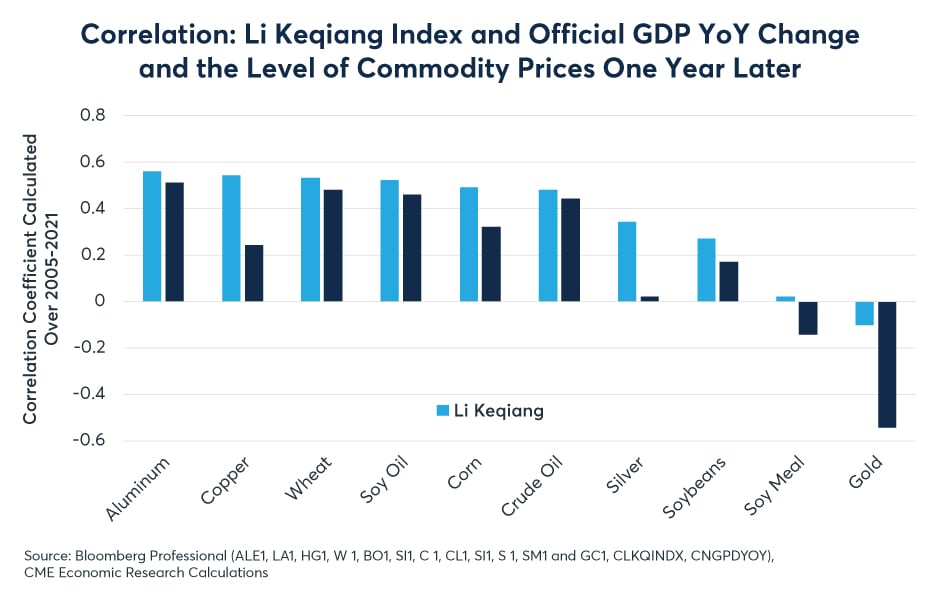
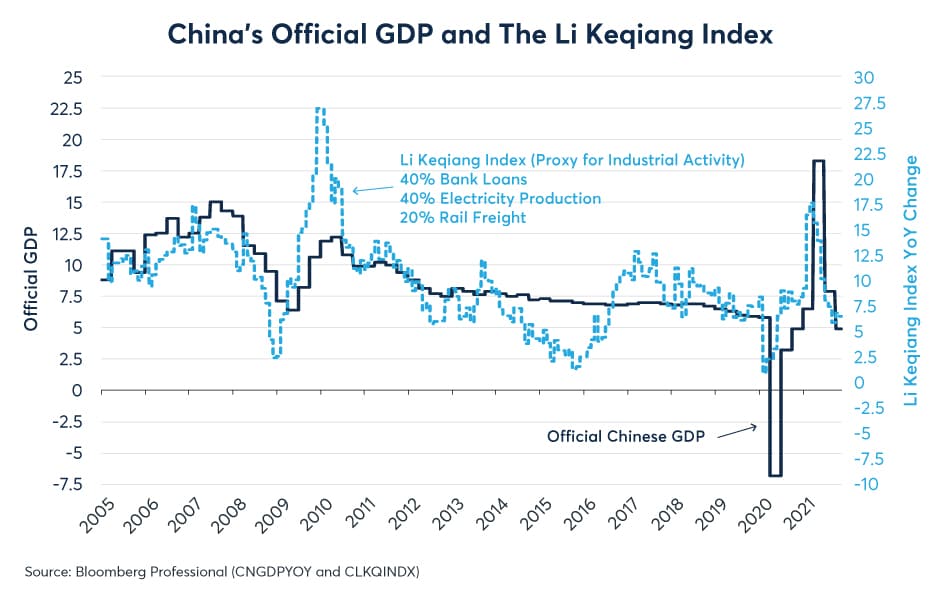
Going into 2022, the index might continue to correlate highly with global commodity prices. China continues to consume 40%-70% of the world’s industrial metals as well as close to one-fifth of the world’s energy and one-sixth of the world’s food. The Li Keqiang index would likely detect any significant change in China’s pace of economic growth, and since the index is released monthly rather than quarterly, it might pick up those variations before it becomes apparent in China’s official GDP.
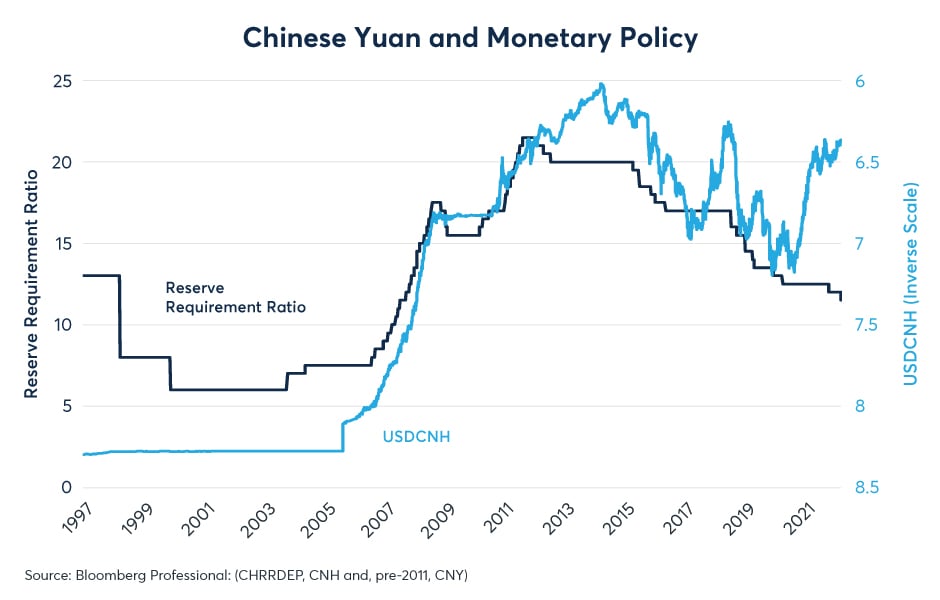
Going into 2022, the main downside risk for China is its property sector, where construction activity is slowing, and real estate prices have begun to decline. Balancing against this risk is easier monetary policy. At a time when many central banks have either begun to tighten policy or appear potentially poised to do so soon, the People’s Bank of China is actively easing monetary policy, having recently reduced its reserve requirement ratio for the second time this year (Figure 3). A lower reserve requirement ratio might boost the availability loans to China’s corporations. Bank loans account for 40% of the index.
Figure 3: China is easing monetary policy even as the rest of the world tightens
Here is a quick look at how different commodities have responded to variations in the Li Keqiang Index in the past:
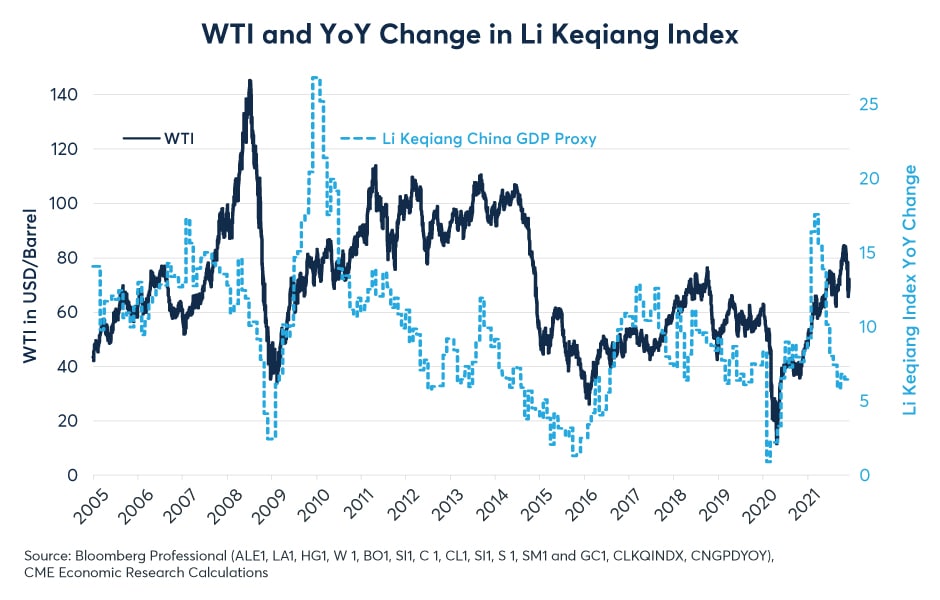
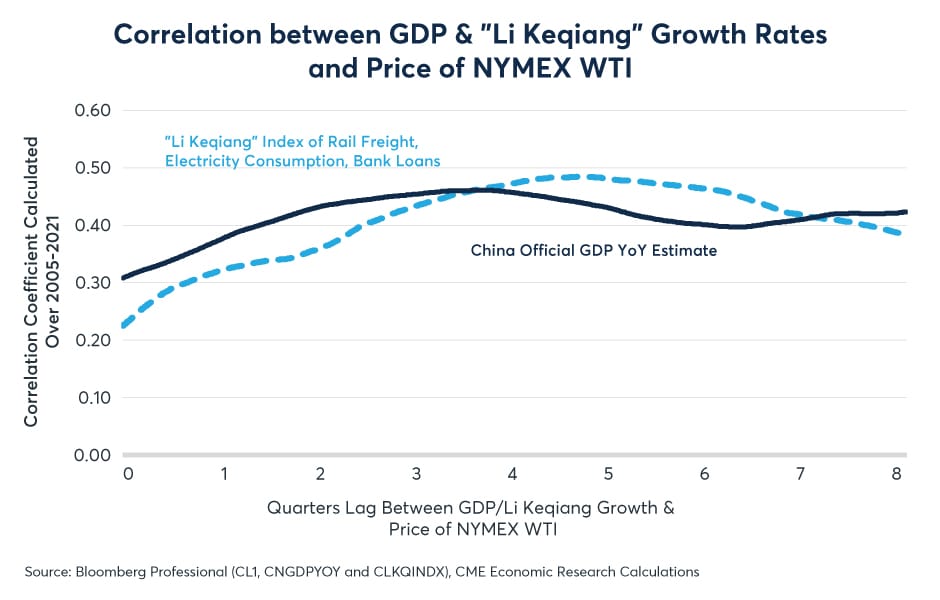
Crude Oil: energy markets pay a great deal of attention to the swing producers of oil, but China may well be the swing consumer. Pre-pandemic oil consumption was fairly stable in Europe and the U.S., but it grew rapidly in China, especially during periods when China’s economy was growing quickly. As such, it comes as little surprise that crude oil prices follow the Li Keqiang index, and sometimes with long lags. Peak correlation for oil comes 4-5 quarters after a change in the Li Keqiang index (Appendix Figures 1 and 2).
Appendix Figure 1
Appendix Figure 2
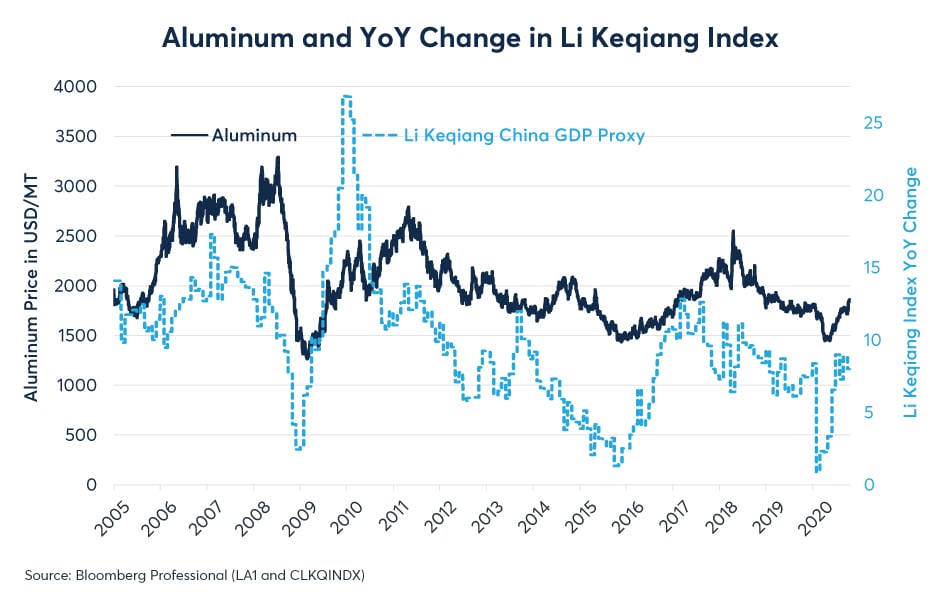
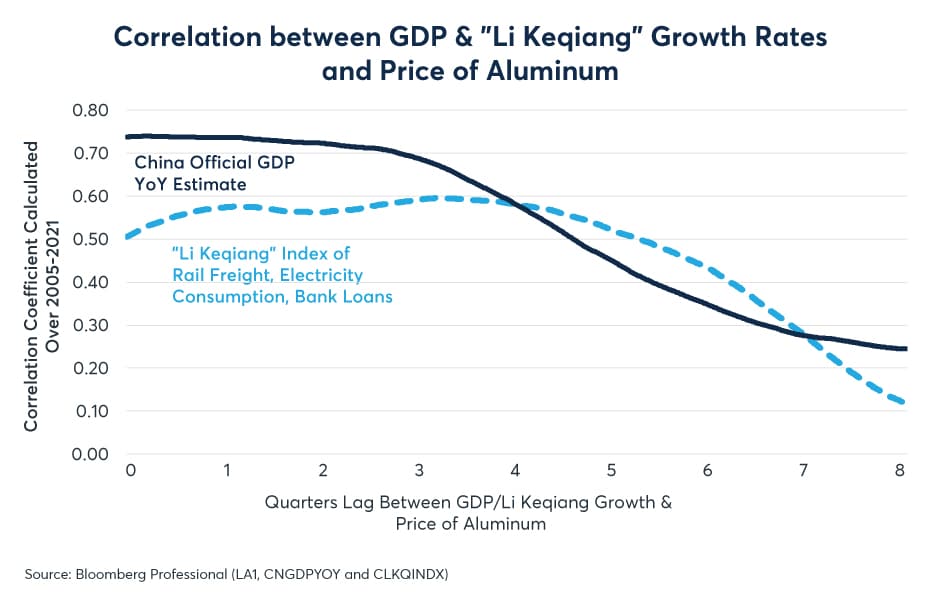
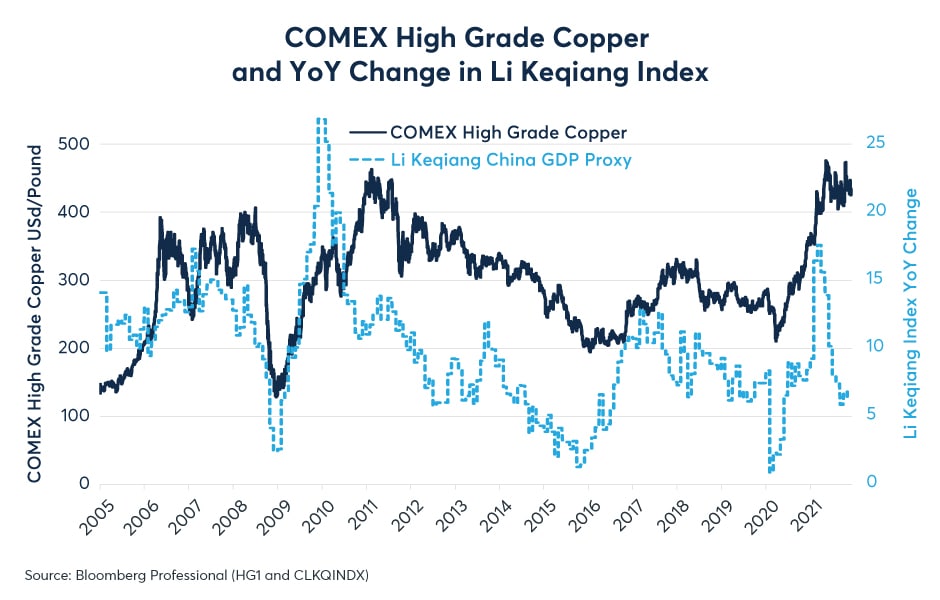
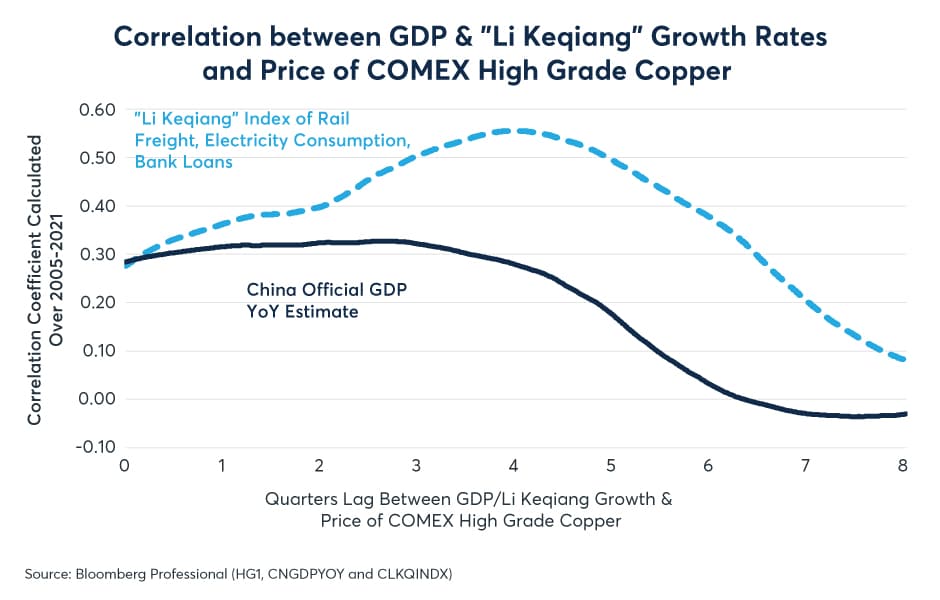
Industrials metals: aluminum and copper show the strongest correlation to the Li Keqiang index. Unlike most other commodities, the metals have shown a strong contemporaneous correlation to changes in the Li Keqiang index as well as strong lagged correlations. That said, the correlation peaks at around one year (four quarters) for both metals (Appendix figures 3-6).
Appendix Figure 3
Appendix Figure 4
Appendix Figure 5
Appendix Figure 6
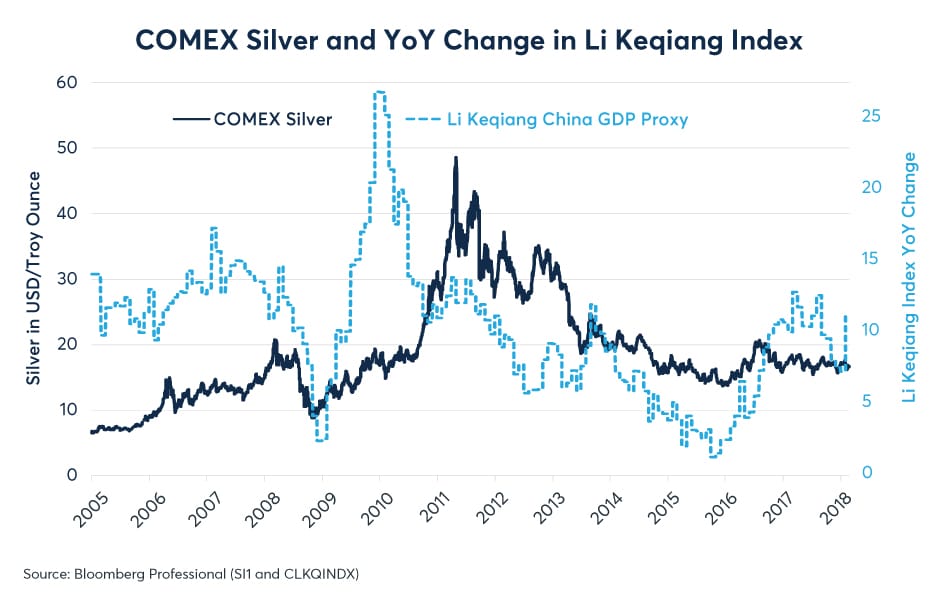
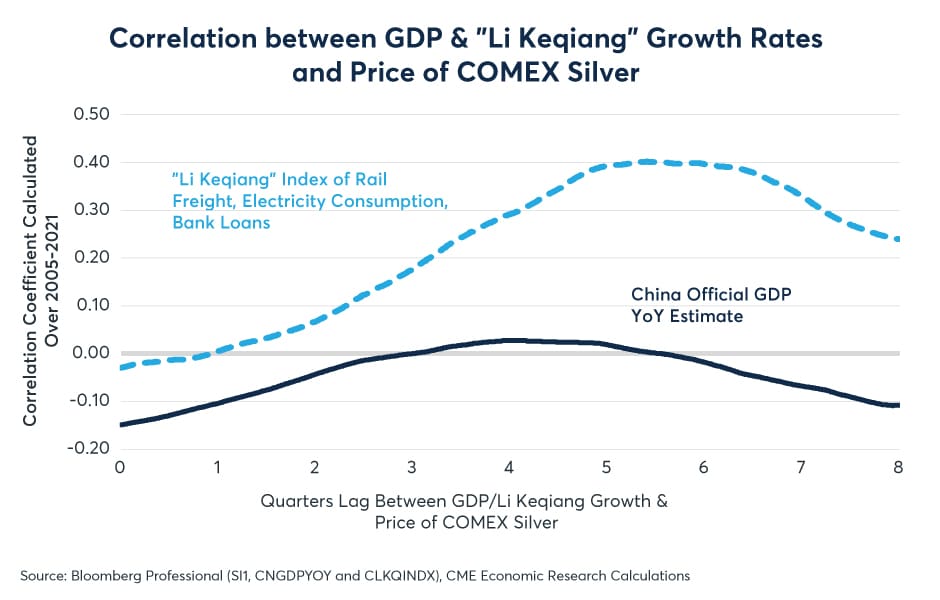
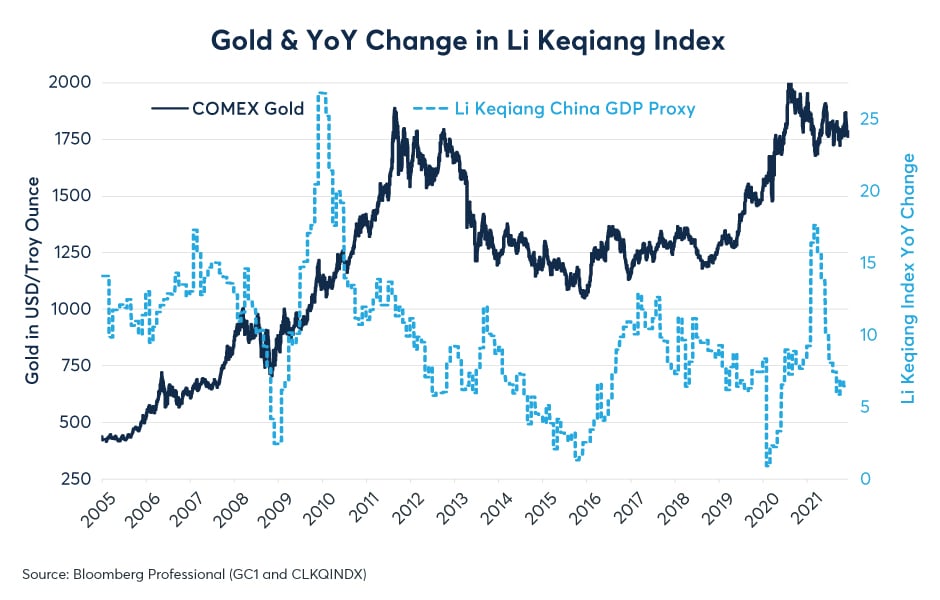
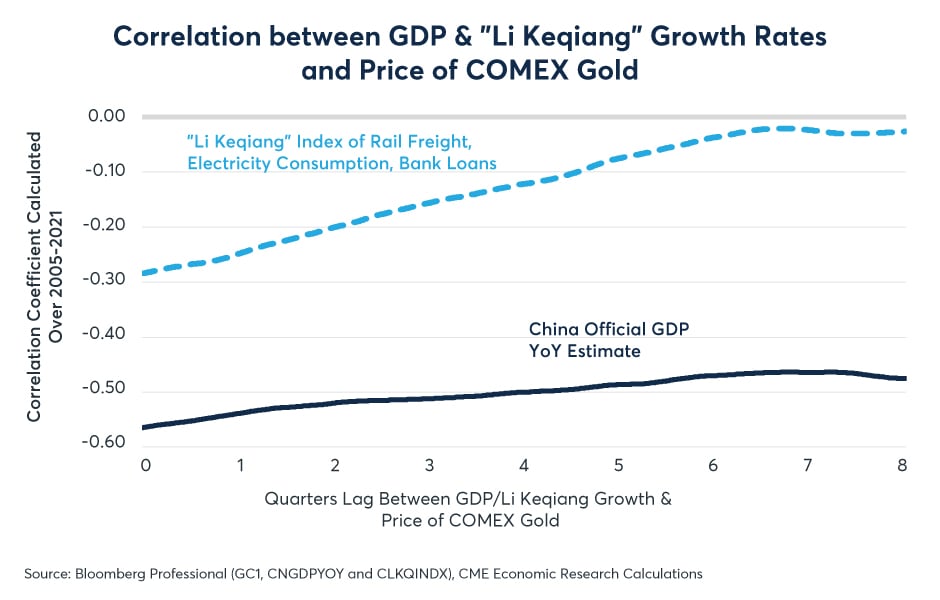
Precious metals: silver has a somewhat weaker but still positive correlation that peaks at around 5-6 quarters after a change in the Li Keqiang index. Silver prices correlate negatively with GDP. Meanwhile, gold is one of the few commodities that correlates negatively with the Li Keqiang index. Stronger Chinese economic growth may be good news for most commodities but, on balance, it tends not be good news for gold (Appendix figures 7-10). Silver’s positive correlation is probably best explained by the fact that it has many industrial uses while gold has relatively few. Around 65% of silver is used for some sort of industrial purpose compared to only around 5% for gold. Unlike other metals, the yellow metal is used overwhelmingly for investment purposes.
Appendix Figure 7
Appendix Figure 8
Appendix Figure 9
Appendix Figure 10
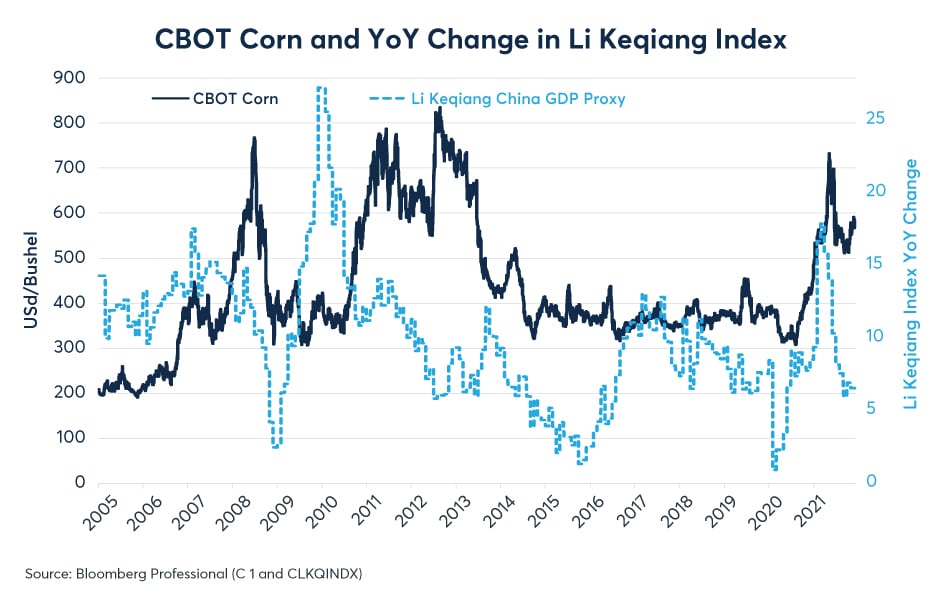
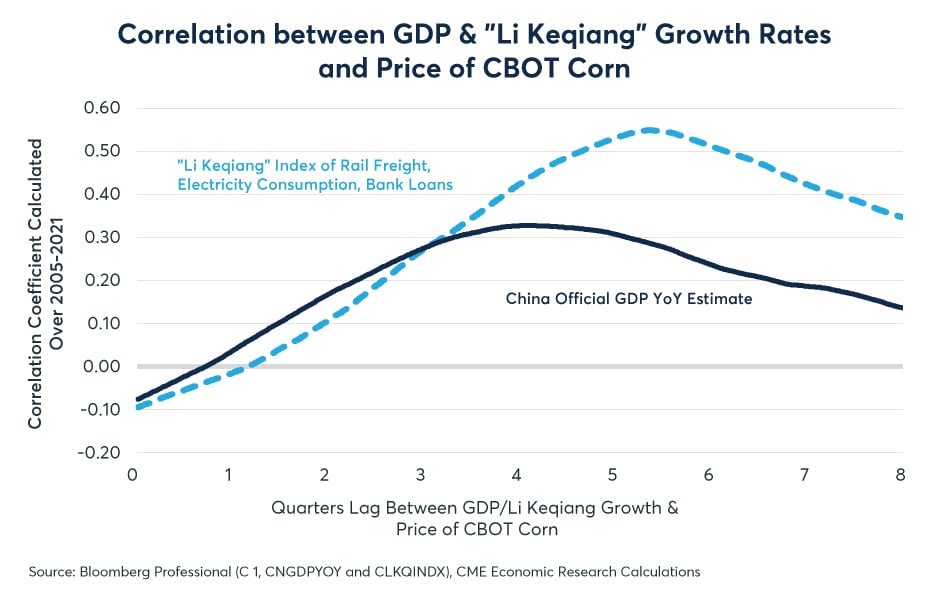
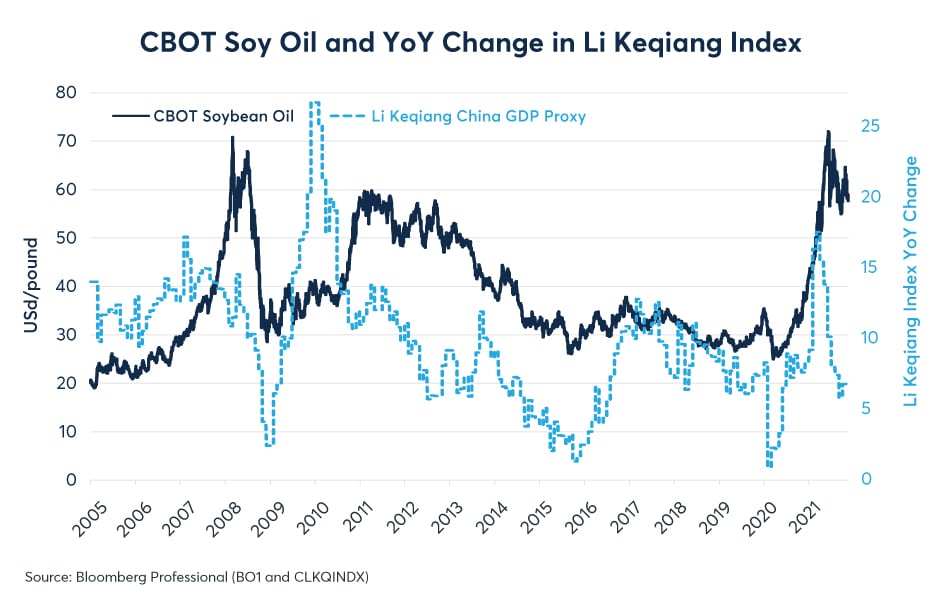
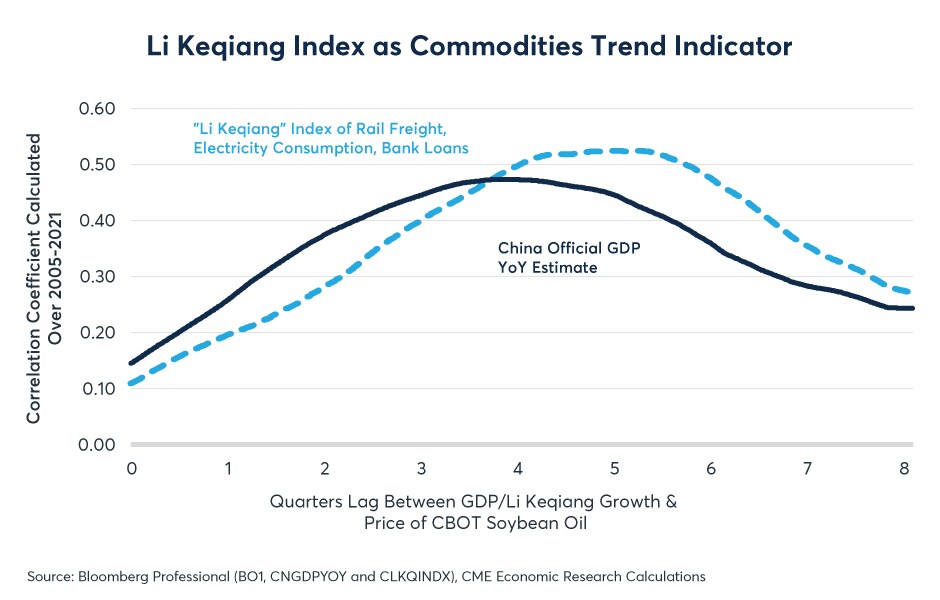
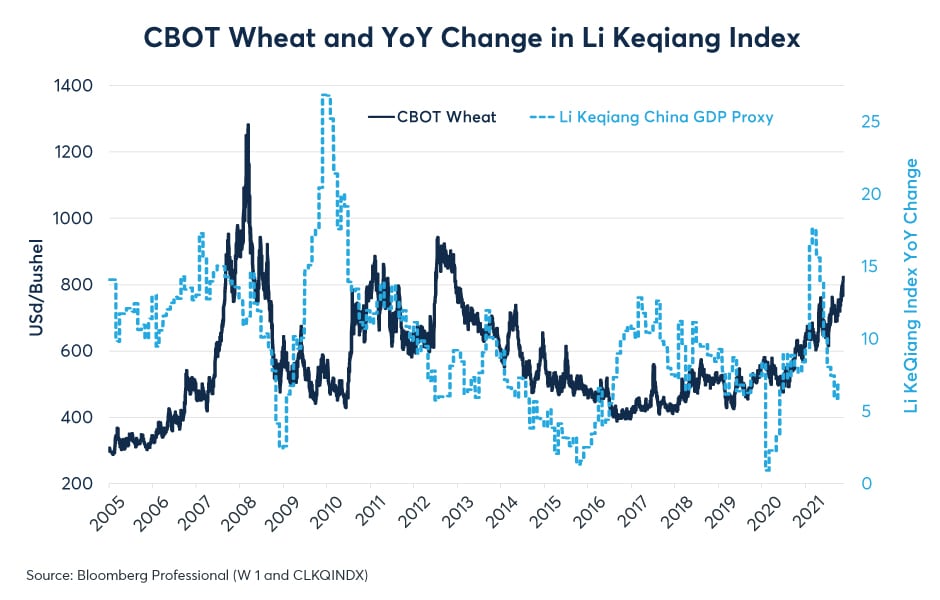
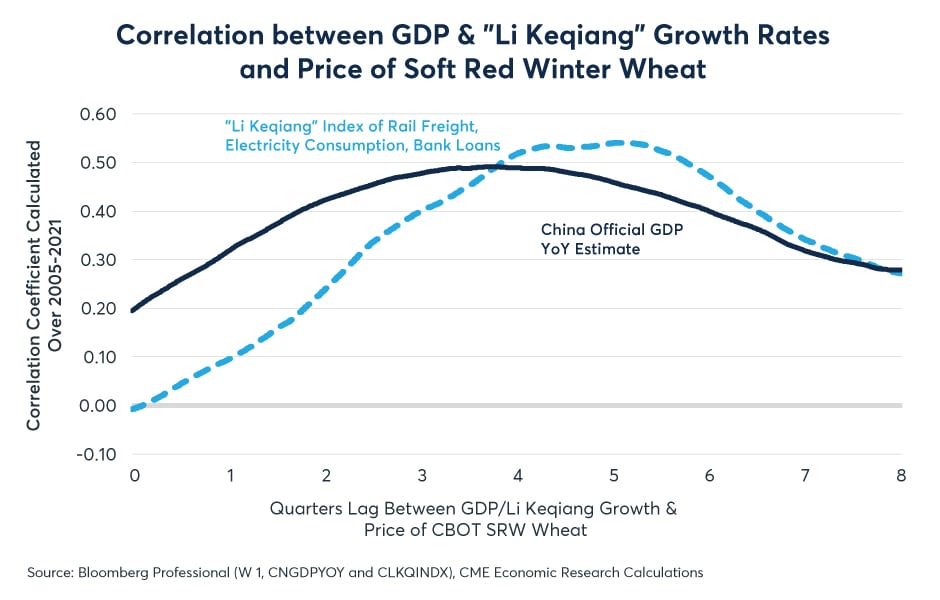
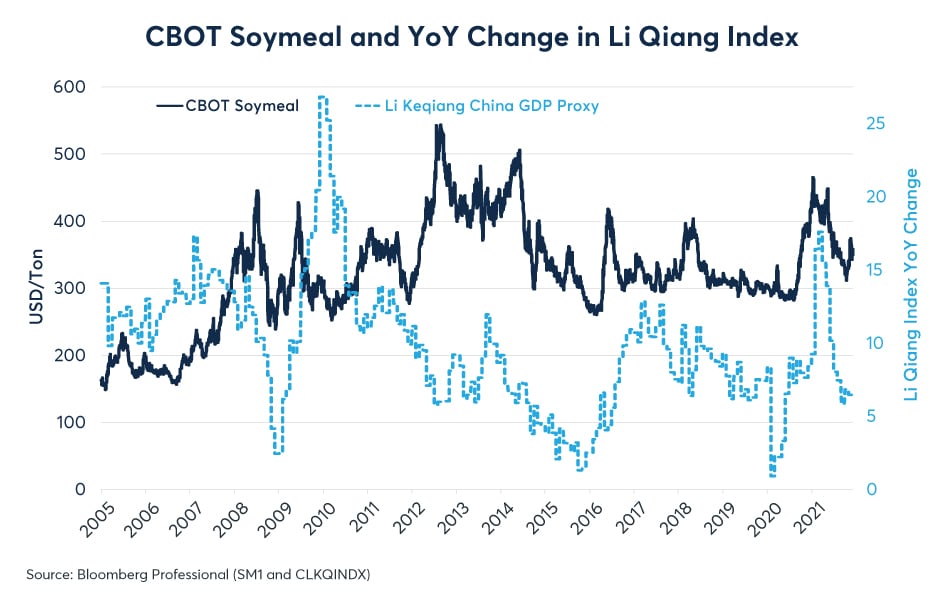
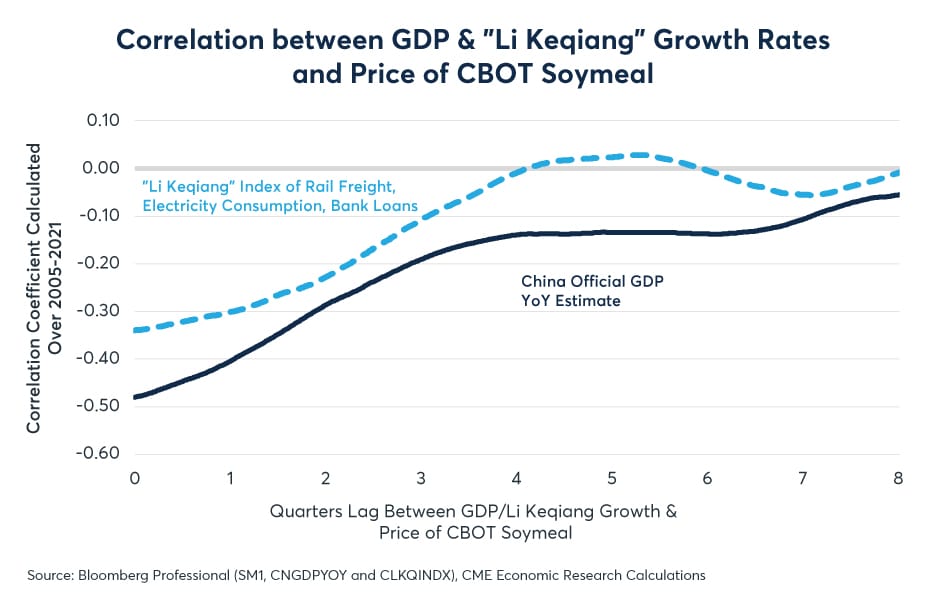
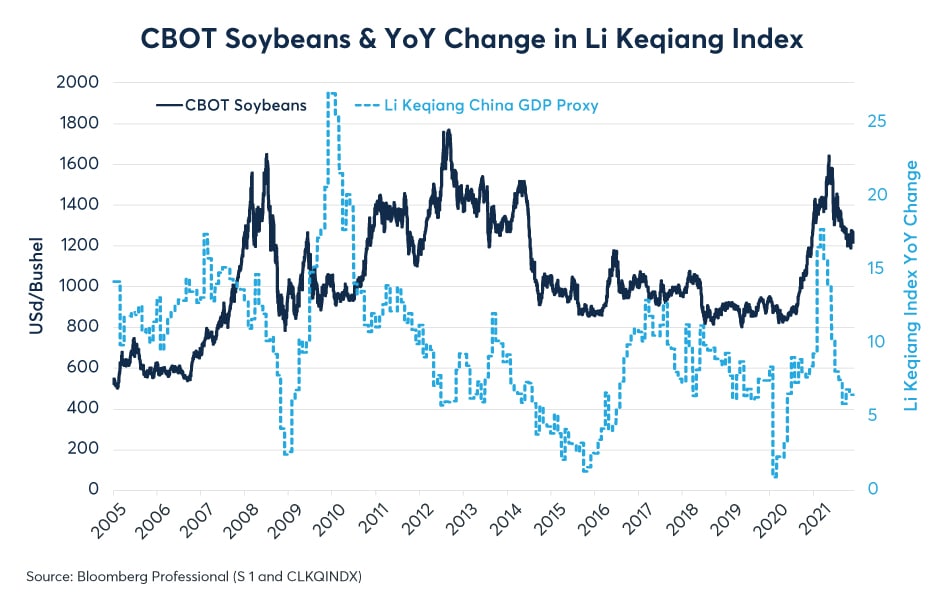
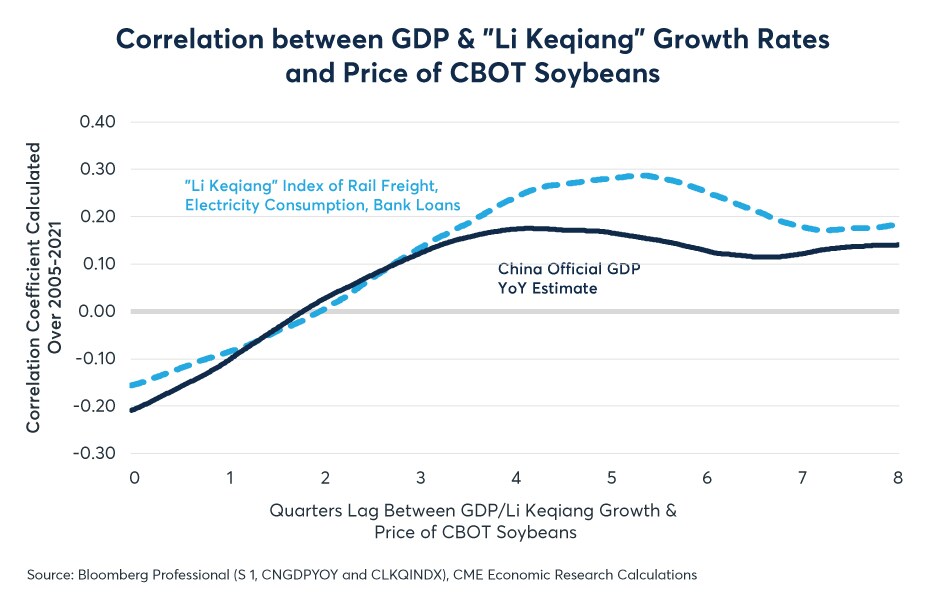
Agricultural goods: corn, soybean oil and wheat demonstrate among the highest correlations with the Li Keqiang index and the correlation tends to peak five to six quarters after a move in the index –somewhat later than the peak correlation for metals and energy goods. Soymeal, like gold, tends to have a negative correlation with Li Keqiang. The difference is that corn, wheat and soybean oil can be used as biofuels and tend to correlate positively with crude oil prices. As such, they may be more heavily influenced by changes in the pace of China’s growth rate. By contrast, soybean meal is used primarily as animal feed and, like lean hog prices, shows little response to changes in the pace of Chinese growth. Finally, soybeans fall somewhere between bean oil, which is strongly correlated, and soymeal, which shows little correlation (Appendix figures 11-20).
Appendix Figure 11
Appendix Figure 12
Appendix Figure 13
Appendix Figure 14
Appendix Figure 15
Appendix Figure 16
Appendix Figure 17
Appendix Figure 18
Appendix Figure 19
Appendix Figure 20
The bottom line is that variations in the pace of China’s growth rate have continued to reverberate through commodity markets, often with significant lags of one year or more. For the moment, many commodity markets may still be benefitting from the extraordinary rebound in China’s manufacturing sector in the second half of 2020 and the first half of 2021. The future of China’s manufacturing growth depends on which forces prove more powerful: booming demand for manufactured goods and an easier monetary policy or a sharp slowdown in the pace of growth in China’s real estate and construction sectors. Data from the second half of 2021 suggest that the pace of growth in China has slowed substantially and, if the past is any guide, this might suggest a somewhat softer demand for many commodities in 2022.
The preceding post was written and/or published as a collaboration between Benzinga’s in-house sponsored content team and a financial partner of Benzinga. Although the piece is not and should not be construed as editorial content, the sponsored content team works to ensure that any and all information contained within is true and accurate to the best of their knowledge and research. The content was purely for informational purposes only and not intended to be investing advice.