


(Thursday market open) Stocks showed signs of life late yesterday, powered by mega-caps, but those shares lost ground in premarket trading as the rally petered out. Treasury yields climbed to fresh highs this morning, increasingly weighing on equities as the opening bell approached.
“Calmness appears to prevail amid uncertainty ahead of tomorrow’s PCE report,” says Randy Frederick, managing director of trading and derivatives at the Schwab Center for Financial Research, referring to the August Personal Consumption Expenditures (PCE) prices data due out early Friday. It’s the Federal Reserve’s preferred inflation report and could help set the tone for coming days (see more below).
Wednesday’s comeback began soon after the S&P 500® Index (SPX) sank to an intraday low of 4,238 at around 12:30 p.m. ET. There was no obvious technical trigger for the rally that lifted the SPX more than 1% from its low in less than two hours, but it may have represented a flight to perceived safety in some of the biggest names.
The positive view is that the SPX is now up two of the last three days, though a glass-half-empty observer might remind us that it’s down 7% from the late-July peak and barely rose Wednesday. Still, a rally must start somewhere—if that’s what this is. September is traditionally the worst month of the year for stocks, and it certainly lived up to its reputation, with the broader market down more than 5% so far. But the October earnings season could give investors more to chew on beyond the endless drumbeat of yields, the dollar, and crude oil.
Contrarian indicators also flash some positive signals.
“This week, equity volume put/call ratios are back to bearish extremes (which is bullish),” Frederick says. “At extremes they become contrarian, implying a decent chance of a short-term bounce.”

Morning rush
- The 10-year Treasury note yield (TNX) climbed another 4 basis points near a 16-year high of 4.66%, still pushed up by the Fed’s “higher for longer” narrative.
- The U.S. Dollar Index ($DXY) slipped to 106.31.
- Cboe Volatility Index® (VIX) futures were flat at 18.28.
- WTI Crude Oil (/CL) fell slightly to $93.61 per barrel.
The VIX hit its highest level since May yesterday, approaching 20. It had fallen below 13 earlier this month but is now having its most dramatic rally since the banking industry turmoil last March. This is the last week of the quarter, and it’s not uncommon for volatility to pick up during such periods as fund managers conduct “window dressing” by dumping losers and adding winners before mailing quarterly results to their clients.
Just in
Weekly initial jobless claims remained on the low end of the spectrum at 204,000, the government said early Thursday. Analysts had expected 215,000. It’s only one week of data, but extends a string of historically light reports, perhaps signaling the labor market remains strong despite rising rates.
The government’s final estimate for Q2 Gross Domestic Product (GDP)—yes, we’re going all the way back to the April-through-June period—was unchanged at the headline level at an annual rate of 2.1%. The report showed a surprising downward revision in consumption to 0.8% from the previous 1.7%, driven by weakness in services. This is unlikely to play into the Fed’s policy, however, being that the data is so old.
What to watch
Friday brings Personal Consumption Expenditures (PCE) prices for August, the inflation metric watched most closely by the Fed.
Here are expectations for August PCE prices, from Trading Economics:
- Headline monthly PCE: +0.5%, versus +0.2% in July
- Headline annual PCE: +3.5%, versus +3.3% in July
- Core monthly PCE: +0.2%. versus +0.2% in July
- Core annual PCE: +3.9%, versus 4.2% in July
Investors might not get too anxious about the headline PCE numbers, which are likely to reflect rising gas prices in August. However, if the core PCE looks hotter than expected, it might fuel concerns that the progress made against inflation is flagging.
Government shutdown: Moody’s Investors Service said this week a shutdown could hurt the U.S. credit rating. Any damage to U.S. credit could mean even higher Treasury yields, though arguably this might be mostly priced into Treasuries considering recent softness. There’s no progress to report from Washington, D.C., suggesting a shutdown could begin this weekend. Goldman Sachs (GS) said a shutdown would subtract 0.2 percentage points from Q4 GDP for every week it continues.
Stocks in spotlight
Micron MU shares fell in premarket trading despite beating analysts’ average estimates on both top- and bottom-lines. The company’s margin also looked stronger. However, guidance for the quarter ahead seemed to disappoint. In its press release, Micron said it’s well positioned for a market recovery in 2024 and sees demand increasing for its memory chips, which have suffered from weak demand in the markets for PCs, data centers, and mobile phones, Barron’s notes. Micron’s weakness this morning appears to be spreading to other chipmakers as well.
Nike NKE faces negative sentiment heading into its earnings report after the close. It received a downgrade from Jefferies earlier this week, and both Jefferies and Wells Fargo WFC recently reduced their price targets. Shares are already down nearly 20% this quarter, much worse than the performance of the broader market. Weak guidance earlier this quarter from competitor Dick’s Sporting Goods DKS might play a part, as it pointed to softer consumer demand. Nike also continues to deal with inventory issues, but much of the overall negativity might be priced into the stock, according to Briefing.com.
Eye on the Fed
Early this morning, the probability that the Federal Open Market Committee (FOMC) will raise its benchmark funds rate from its current 5.25% to 5.50% target range following its October 31–November 1 meeting was 22%, according to the CME FedWatch Tool, and down slightly from a week ago. Odds that rates could be a quarter-point higher coming out of the December 12–13 meeting were about 42%, also down slightly from a week earlier.
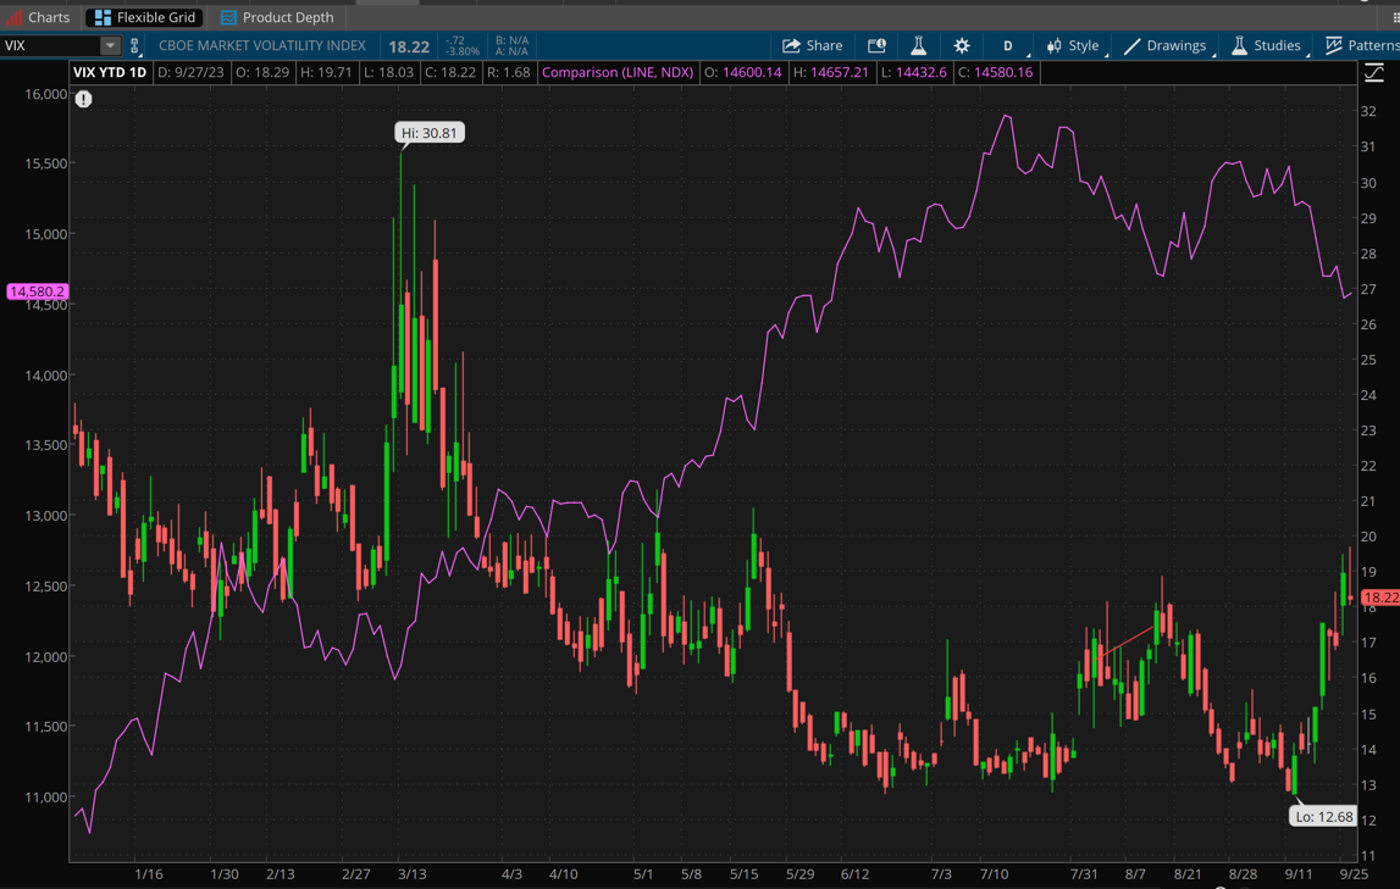
CHART OF THE DAY: GAP CLOSING. Light volatility most of the summer (VIX—candlesticks) aligned with a firm market for info tech as represented here by the Nasdaq 100 (NDX—purple line). As VIX rocketed late this month, the NDX began to lose its edge. Data sources: Nasdaq, Cboe. Chart source: The thinkorswim® platform from TD Ameritrade. For illustrative purposes only. Past performance does not guarantee future results.
Thinking cap
Ideas to mull as you trade or invest
Inflation rips staples. The consumer staples sector posted its lowest close since November 2022 earlier this week just in time for Tuesday’s earnings report from Costco COST, one of its biggest components. This could raise eyebrows, considering the growing recession worries due to rising rates and the perception of staples as a “defensive” sector that investors can flock to during hard times. We all need 64-packs of paper towels, even when the economy sinks, right? The rub against staples now partially reflects inflation, but not in the way one might suspect. Rising prices tended to help staples companies in the past, allowing them to juice margins by raising prices. Now, inflation has pulled back and consumers have become more resistant to price hikes, according to many companies that reported in Q2. “Many of the staples companies are no longer benefiting from inflation to boost prices,” says Kevin Gordon, senior investment strategist at Schwab. The other target on staples now is that higher Treasury yields make it harder for them to lure investors through generous dividends. The dividend yield for staples now is 2.7%, according to Bloomberg data. That’s only 60% of the yield an investor would receive on a 10-year Treasury note.
Shifting sands: It may seem lately like everything’s gone down at once, but the market isn’t monolithic, and investors shouldn’t trade it that way. For instance, it’s widely understood that “mega-cap” tech and communication services stocks have lost much of their spring and summer mojo, but two of the largest in that category—Meta Platforms META and Alphabet GOOGL—are up this quarter. “The companies in the ‘Super 7’ don’t all look the same,” Gordon notes. Also, traditional defensive areas like utilities and staples (as noted above) have slumped even when you’d think investors would embrace them amid recession worries. In fact, the only sector that’s really had traction this quarter is energy, a “cyclical” sector that typically performs best when the economy gains ground. How can investors weary of the market’s 2023 roller coaster approach these uncertain times? “Playing defense today means moving up the quality spectrum via screening for companies that have high and rising interest coverage ratios, positive earnings revisions, and a strong outlook for both revenue and earnings growth,” Gordon says.
VIX uncoiled: Unlike earlier this year when the Cboe Volatility Index® (VIX) surged as stocks fell but outlying VIX futures indicated cooling, the current VIX outlook holds little relief for bullish investors. Contracts further out on the Cboe futures curve indicate rising volatility, with VIX staying near 19 the rest of the year and topping 20 by March. Those are historically near average but should be cautionary considering how recently VIX was below 13 (earlier this month). It shows how quickly the outlook can worsen. Investors might want to keep an eye on those forward months for any indications of improvement or deterioration. As for the current level, it’s up from three-year lows earlier this month but still shy of 20, which may signal that there’s not a lot of investor panic as the market marches lower. A VIX near 20 implies an average daily S&P 500® Index (SPX) move of around 42 points a day, up from the September average of 26 points. The rock-bottom VIX levels of a few weeks ago were unlikely to last, in any case. “The VIX was a coiled spring after reaching a 44-month low back on September 14,” says Schwab’s Randy Frederick.
Calendar
Sept. 29: September Chicago PMI, August Personal Income and Personal Spending, August Personal Consumption Expenditures (PCE) prices, and expected earnings from Carnival Corp. (CCL).
Oct. 2: September ISM Manufacturing Index and August Construction Spending.
Oct. 3: August Job Openings and Labor Turnover (JOLTS).
Oct. 4: September ISM Non-Manufacturing Index and August Factory Orders.
Oct. 5: August Trade Balance, and expected earnings from Conagra (CAG).
TD Ameritrade® commentary for educational purposes only. Member SIPC.
Image sourced from Shutterstock
This post contains sponsored content. This content is for informational purposes only and not intended to be investing advice.
Edge Rankings
Price Trend
© 2025 Benzinga.com. Benzinga does not provide investment advice. All rights reserved.
Trade confidently with insights and alerts from analyst ratings, free reports and breaking news that affects the stocks you care about.

