


(Monday market open) After U.S. stocks suffered their worst week since March, investors trudge back Monday to a market that’s limping technically and appears to lack clear catalysts to reignite bullish sparks. Major indexes come into the week on a four-session losing streak but rebounded slightly in premarket trading.
While Walt Disney DIS reports Wednesday and key inflation data follow on Thursday, a relative lack of news along with weak seasonal trends help explain the retreat from recent 16-month highs. In addition, all major indexes finished last week below closely watched moving averages on the charts, fueling bearish sentiment.
With more than three-quarters of earnings season over, better-than-expected results weren’t enough to sustain the rally. Although there were exceptions like Amazon AMZN and its post-earnings celebration last week, many companies didn’t see their stocks benefit much from quarterly numbers, implying that the market built in strength ahead of time.
Even a sharp drop in Treasury yields on Friday from recent nine-month highs couldn’t move the needle for bulls. Despite the retreat, yields remain elevated from where they’ve spent most of the year. Rising commodity prices could also make the Federal Reserve’s job tougher as it fights inflation. Treasury yields bounced again early Monday.
Today's Best Finance Deals
Morning rush
- The 10-year Treasury note yield (TNX) rose 3 basis points to 4.09%.
- The U.S. Dollar Index ($DXY) is steady near 102.2.
- Cboe Volatility Index®® (VIX) futures are near unchanged at 17.1.
- WTI Crude Oil (/CL) fell slightly to $82.14 per barrel.
Stocks in Spotlight
Last week’s sharp losses came despite 79% of S&P 500 companies reporting to date beating Wall Street’s earnings per share expectations and 65% reporting a positive revenue surprise, according to FactSet. Those are historically solid, but the S&P 500® Index (SPX) is roughly flat since mid-July when earnings season began.
That’s true whether you look at the SPX itself or the S&P Equal Weight Index (SPXEW), which weighs all S&P 500 stocks the same to avoid outsize impact from the top 10 in terms of market capitalization.
Earnings in general have been far better than expected, but expectations were low from the outset. The average EPS loss now is 5.2%, FactSet says. At one point, the expectation was for a 9% average loss. Unfortunately for investors, the market isn’t rewarding earnings beats as it normally does, signaling perhaps that stocks are fully priced, says Joe Mazzola, director of trader education at Schwab.
- In the period spanning two days before releasing earnings and the two days after, companies that reported positive earnings surprises for Q2 have seen an average price decrease of 0.5%.
- This is well below the five-year average price increase of 1% during this same window, per FactSet.
- During that time frame, companies that reported negative earnings surprises for Q2 2023 have seen an average price decrease of –2.4%.
What to Watch
Waiting game: This week’s data calendar is backloaded. Two of the most closely watched monthly data points will be released on Thursday and Friday: The July Consumer Price Index (CPI) and the July Producer Price Index (PPI), respectively.
With these indicators, one thing to watch is year-over-year growth, which might look a bit more robust compared to the cooler readings in June. That’s because comparisons aren’t as easy, as annual CPI peaked in June 2022 at above 9% and improved after that.
China recovery: China reports July inflation Tuesday evening (Wednesday morning in China). The question is whether China avoids outright deflation as the shutdown recovery continues to be sluggish, says Michelle Gibley, director of international research at Schwab Center for Financial Research. Analysts expect monthly inflation in China to rise 0.2%, according to Trading Economics. Annual inflation is seen down 0.3%.
Earnings watch: On the earnings front, things are winding down following two weeks when a combined two-thirds of S&P 500 companies reported. Only 33 S&P companies will report over the next five days, including Disney after Wednesday’s close. Others to watch in the coming days include UPS UPS, Under Armour UAA, Palantir PLTR, Eli Lilly LLY, and Lyft LYFT.
- Palantir’s results are due out after the close today. The software company’s shares rose sharply back in May after it beat Wall Street’s expectations the last time it reported. Updates on its artificial intelligence platform and customer count are both likely touchpoints this afternoon.
- Eli Lilly’s earnings tomorrow morning put the spotlight on market progress for its revenue-driving weight-loss therapies and the timeline for expected U.S. approval of its Alzheimer’s drug. The stock has had a strong start to 2023 despite weakness in the health care sector.
- Tyson (TSN) kicked off the week by missing analysts’ earnings estimates and seeing shares pull back 6% in premarket trading. “Current market dynamics remain challenging,” the company said in a press release early Monday, adding that it will close four chicken plants.
Eye on the Fed
Futures trading indicates a 15% probability that the FOMC will raise rates at its September meeting, according to the CME FedWatch Tool. The probability for November is 30%. The market is starting to build in a very small chance of hikes in both September and November.
Over the weekend, Fed Governor Michelle Bowman said she expects “additional rate increases,” according to Bloomberg. That’s “increases”—plural. Just one more 25-basis-point rate hike would take the target rate to the Fed’s projected terminal, or peak, of between 5.5% and 5.75%. However, New York Fed President John Williams told The New York Times he thinks the hiking cycle is near a peak and that rates could fall next year.
Talking technicals: One reason behind the swoon in stocks late last week could be three of the largest U.S. stock indexes falling below their respective 20-day moving averages. This suggests a near-term momentum shift, says Nathan Peterson, director of derivatives analysis at the Schwab Center for Financial Research, though he adds that technically, the SPX remains in an up-trend.
If you’re looking for potential technical support, the SPX might have some near 4,450, which would represent a 3% decline from the 2023 closing high posted last Monday. That level is also near prior highs in mid-June and early July. Below that, support might be at the 50-day moving average near 4,400.
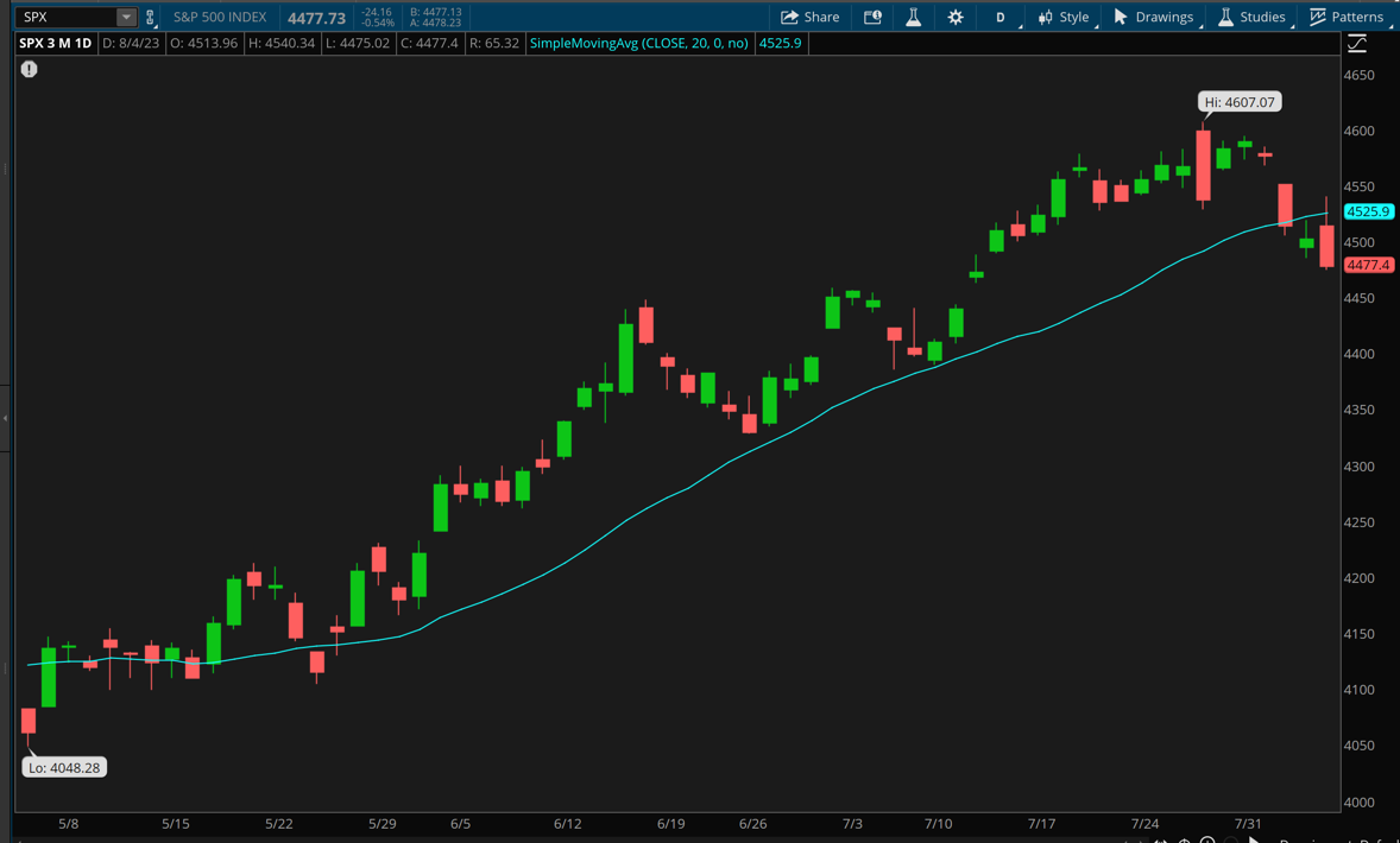
CHART OF THE DAY: 20 QUESTIONS. The S&P 500 index (SPX—candlesticks) suffered a technically poor end to its week Friday, sinking below its 20-day moving average (blue line) after an early climb above that level failed. The 20-day moving average was 4,526 to end last week, which could now represent technical resistance. Data source: S&P Dow Jones IndicesChart source: The thinkorswim® platform from TD Ameritrade. For illustrative purposes only. Past performance does not guarantee future results.
Thinking cap
Ideas to mull as you trade or invest
Payrolls post-op: Last Friday’s July Nonfarm Payrolls data fueled fresh hopes of a possible “soft landing” for the economy. Jobs growth measured by the establishment survey was 185,000 in June and 187,000 in July, helping push down swollen Treasury yields. At the same time, the household survey was quite strong, with July growth of 268,000. As a reminder, the government’s establishment survey is a sample of businesses, while the household surveys U.S. households. This continued a divergence that began in April 2022. While household led growth in June and July, it’s trailed establishment over the last 16 months by nearly 2 million jobs. Household tends to lead at inflection points in the economy, so it would be an anomaly historically if we didn’t see a meaningful downtrend in nonfarm payrolls, says Kevin Gordon, senior investment strategist at the Schwab Center for Financial Research.
Yield riddle: One question if you’ve watched Treasury yields climb over the last week is why this occurred when the latest inflation readings looked relatively benign. It’s likely a combination of recent events, including the Bank of Japan (BoJ) upwardly adjusting the range where will let its yields fluctuate, the downgrade of U.S. credit by Fitch Ratings last week, and a host of new debt issuance by the U.S. Treasury. All this put pressure on the Treasury market, though yields retreated from nine-month highs on Friday following comforting U.S. jobs data. Still, keep an eye on the 4.33% level for the 10-year yield, which represents last year’s high and possible technical resistance. More Treasury auctions await this week, which conceivably could put additional pressure on the Treasury market and perhaps send yields higher.
Reversal of fortune? In the wake of last week’s volatility, one thing got lost in the shuffle: The “key reversal” of the SPX back on July 27. That was the day the SPX posted a new high for the year of 4,607 soon after the open but then quickly turned tail and ended up closing lower than the previous day as the 10-year Treasury yield climbed back above 4%. While terms like “key reversal” often get thrown around, it’s arguable this price action led to some of the volatility last week and put stocks on their heels. The SPX hasn’t come close to testing those late-July highs again. The 4,600 level has now withstood four different tests since early 2022 and remains a key technical resistance area that appears to be a gatekeeper on any attempts to recapture the all-time high near 4,800.
Calendar
Aug. 8: Expected earnings from Eli Lilly (LLY), Fox Corporation (FOXA), UPS (UPS), Lyft (LYFT), Wynn Resorts (WYNN), and AMC Entertainment (AMC)
Aug. 9: Expected earnings from Walt Disney (DIS)
Aug. 10: July Consumer Price Index (CPI and core CPI and expected earnings from Alibaba (BABA)
Aug. 11: July Producer Price Index (PPI), core PPI, and University of Michigan Preliminary August Consumer Sentiment
Aug. 14: No major earnings or data expected.
TD Ameritrade® commentary for educational purposes only. Member SIPC.
Image sourced from Shutterstock
This post contains sponsored content. This content is for informational purposes only and not intended to be investing advice.
Edge Rankings
Price Trend
© 2025 Benzinga.com. Benzinga does not provide investment advice. All rights reserved.
Trade confidently with insights and alerts from analyst ratings, free reports and breaking news that affects the stocks you care about.

