
Today, we will dive into the world of customer positioning, guided by options flow data. Our focus is on two main types - aggregated and expiration-based positioning, with AMD as our handy example. We'll remember to mix this data with other information for a full view. We'll also keep our eyes on six key stocks for the next week based on their positioning patterns. Ready to explore the exciting world of trading?
Week At-A-Glance
Last week, the S&P 500 (NYSE:SPY) took a 3% dip due to AAPL's (NASDAQ:AAPL) earnings miss and slowed growth, causing a 7% downward shift in AAPL and disrupting a long-standing uptrend. Will this downturn persist? We'll consult the data soon. On a different note, AMZN (NASDAQ:AMZN) bucked the trend, registering about a 5% increase over the week. But, despite a Friday gap up, it couldn't sustain momentum. The key question now: will we cover the gap down or keep moving upward? Let's delve into the data.


Customer Positioning 101
Now that we've reviewed last week's events, let's dive into our main topic: customer positioning. In this context, we'll focus on options flow data. Simply put, customer positioning reflects the collective sentiment of investors based on their options trades. If customers are purchasing many call options, the positioning leans bullish. Similarly, selling a significant amount of put options also indicates a bullish sentiment. Conversely, if customers are buying puts or selling calls, the positioning tilts bearish.
However, a word of caution: these rules often fail with indices like SPY & SPX. The reason? Their options flow is mostly used for hedging. Hence, these rules apply more accurately to individual stocks.
Types Of Customer Positioning
Using the data we have at Tradytics, we can sort positioning into two main categories: aggregated positioning and positioning by expiration. If this seems a bit complex, don't worry, we'll simplify it. To view these, you'd navigate to 'Charts' then 'Indicators', and choose 'Customer Calls & Customer Puts' for aggregated positioning. For positioning by expiration, you'd select 'Options Sidebar' then 'Customer Positioning'. Now, let's delve deeper to understand these two categories.
1. Aggregated Positioning
When working with flow, remember that dealers take the opposite position of what customers take. So, the customer's sentiment, which is what we focus on, is the reverse of the dealers' charts. To understand customer positioning, head to the 'Charts' page and open 'Indicators'. We divide customer positioning into calls and puts to give a clear picture of how customers use options flow. By subtracting puts from calls, we get a single figure called 'Net Premiums', which is used in the positioning by expiration. Let's illustrate this with an example looking at AMD's (NASDAQ:AMD) aggregated call positioning.


In the customer perspective, green signifies call buying (bullish), and red marks call selling (bearish). If we were to look at a puts chart, red would indicate put buying (bearish), and green would signify put selling (bullish). In the call positioning chart above, it's clear that call positioning and price movement often go hand in hand. As call positioning rises, so does the price, and vice versa. So, what's the current positioning looking like? Take a moment! It appears slightly bullish, as we see green bars recently, even if they're small. This suggests more bullish than bearish sentiment. This is only one piece of the puzzle though; we must also consider put positioning for the full picture. Let's turn to that now.
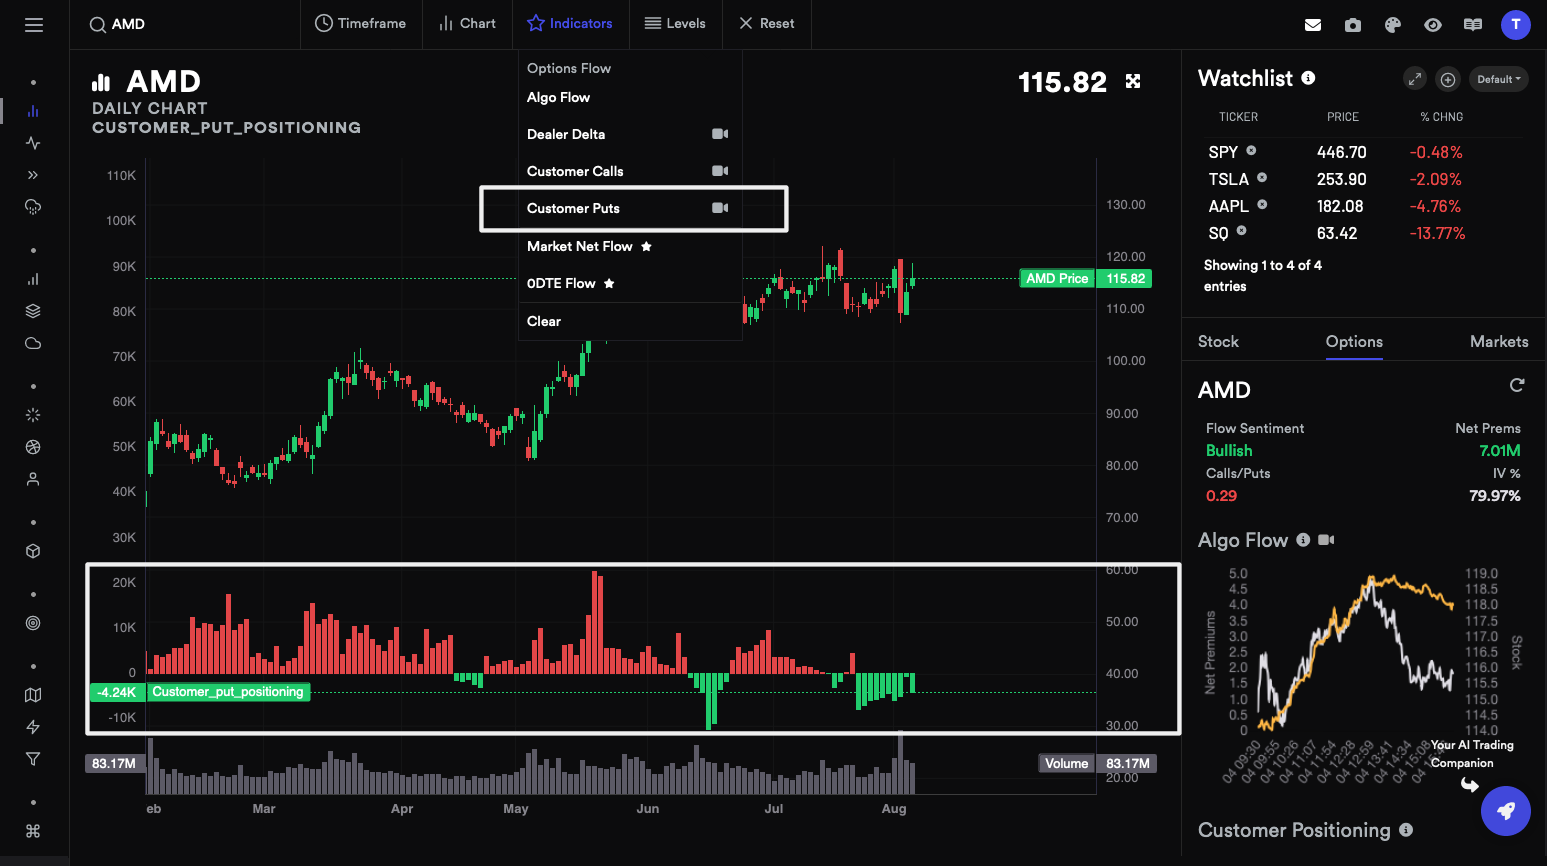

Great news! The recent increase in green bars indicates more put selling, a bullish sign. Since we see bullish trends in both call and put positioning, we can deduce that the overall flow sentiment is also bullish. That's it! That's how you decode and analyze customers' options flow to form a balanced opinion. Relying on data helps us set emotions aside and view things objectively.
2. Positioning By Expiration
Looking at total positioning is crucial, but it's not the whole story. This is because it combines options flow for both short-term and long-term expirations. And clearly, different traders have varying timeframes in mind for their trades. To cater to this, we have something called 'Positioning by Expiration,' or simply 'Customer Positioning,' found in the sidebar options tab on the Charts page. Let's use AMD as our example again, but this time, we'll examine its positioning by expiration.
Before we dive in, let's revisit 'net premiums', which is just the difference between call and put premiums. A quick rule of thumb - green values indicate bullish sentiment, while red ones suggest bearish sentiment.


The white-highlighted chart shows different expirations on the y-axis and net premium values on the x-axis. We've sorted the y-axis based on expiry dates, putting the nearest ones first. A glance at the chart reveals a strong short-term bullish sentiment for AMD, especially towards the August 18th expiration. But as we move towards longer-term expirations, the sentiment appears to shift a bit.
From this, it's evident that a more detailed look gives us a better understanding than just an aggregated figure. So, using a combination of both aggregated and positioning by expiration offers the most comprehensive insight.
Summary
This information should help you understand customer positioning and get you started on interpreting the charts yourself. You can find variations of these charts in the Options Dashboard, but I'd suggest that for more seasoned users. The two charts we discussed offer plenty of insights into understanding positioning. Please remember, since this data comes from all customer flows and all expirations, it's best used as a guide for swing or slightly longer-term trends. If you're interested in day trades, Market Net Flow & Algo Flow are more suited. We'll cover more on these in future articles.
The Week Ahead
Alright, let's take a sneak peek at the week ahead by checking out the customer positioning for six big names - NVDA (NASDAQ:NVDA), MSFT (NASDAQ:MSFT), META (NASDAQ:META), TSLA (NASDAQ:TSLA), AAPL, and PLTR (NYSE:PLTR). We'll use this to sense the mood for next week, giving us a chance to stay ahead of the game. So, let's dive right in.
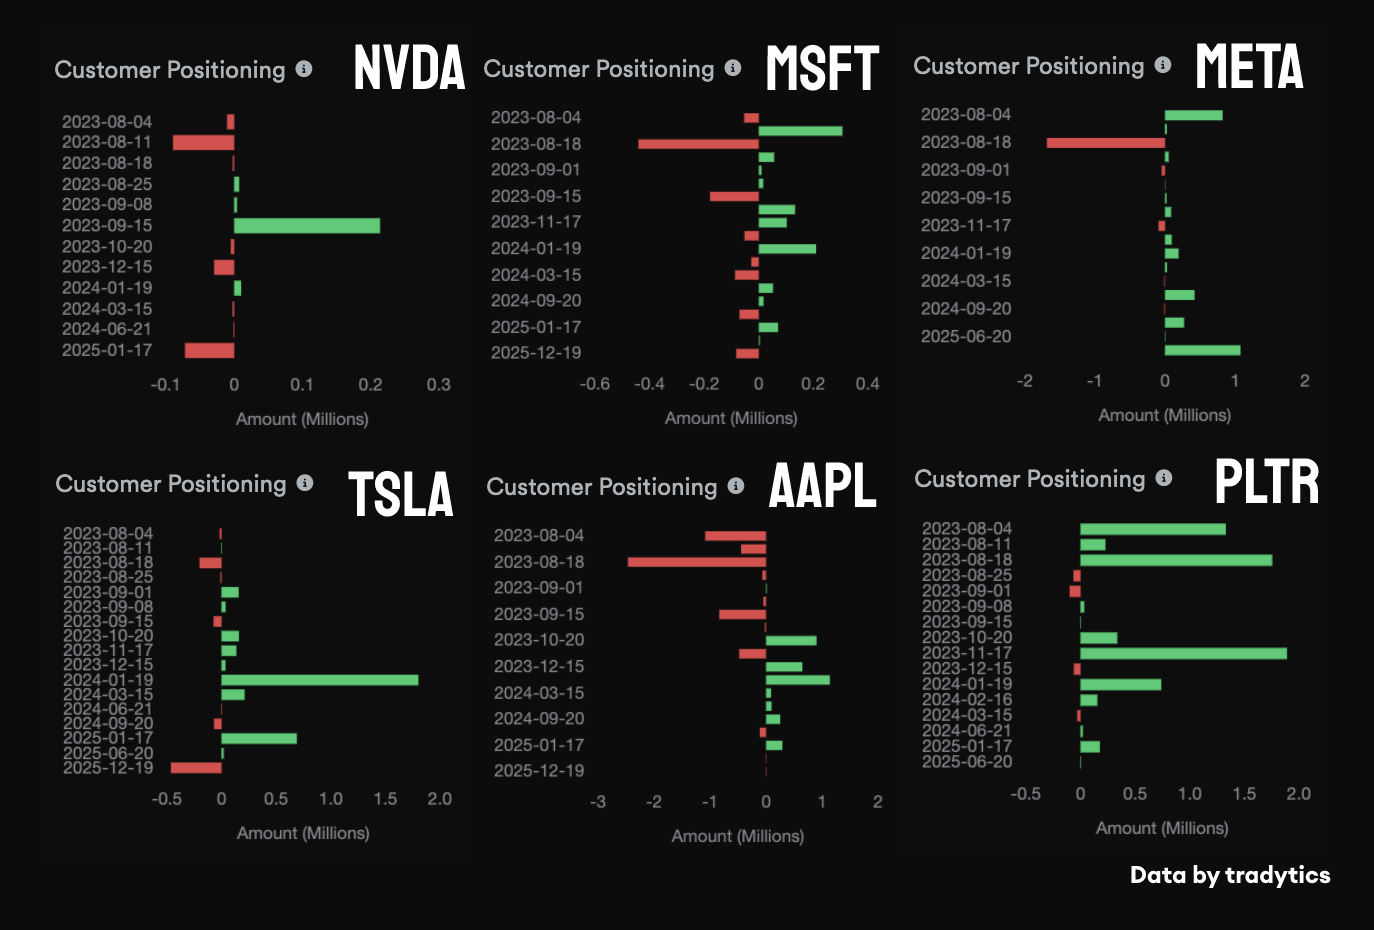


By now, you should be able to identify which stocks show the most bullish or bearish customer positioning, both short-term and long-term. I'll highlight two with the clearest short-term positioning: AAPL and PLTR. AAPL appears bearish in the near term, with some improvement over the long term. In contrast, PLTR is showing lots of green bars, indicating bullish sentiment both short and long term. Interesting to note are the bearish bars for August 18th for META & NVDA, and the strongly bullish long-term sentiment for TSLA. This should give you a handle on positioning and help you make clear-eyed decisions about your trades.
Tips
Pairs Trading
Positioning is just one piece of the puzzle. It's wise to consider various factors before making a final decision. For now, let's stick to positioning. Here's a little tip. To get the best results, try to identify the overall market direction. Find stocks with particularly bullish or bearish positioning. If the market is on an upward trend, you could split your trade capital - say, 70% on a bullish trade to align with the market trend, and 30% on a bearish one as a sort of safety net. If the market dips, the bearish stock is expected to fall more than the rest, providing some protection.
For instance, if the market dips in the next few weeks, you could buy calls (go long) on AMD/PLTR as they show bullish positioning, and buy puts (go short) on AAPL and META. In theory, this should offer good protection and potential gains. This is a basic pairs trading strategy, which we'll delve into another time.
Conclusion
In this week's analysis, we dove into the intriguing world of customer positioning, using options flow data as our compass. We unpacked the details of aggregated positioning and positioning by expiration, using AMD as a prime example. We observed that customer positioning can offer valuable insights into market sentiment, effectively acting as a sentiment barometer. However, it's crucial to note that this single data point should be used in conjunction with other data points to form a holistic view. Looking ahead, we have shortlisted six stocks with notable customer positioning to watch for the next week.
This article was written using data from Tradytics.
© 2025 Benzinga.com. Benzinga does not provide investment advice. All rights reserved.