
On Sunday evening, Benzinga asked its followers on Twitter what they’re buying at the open on Monday. From the replies Benzinga selected one ticker for technical analysis.
@EGT_AlAli, and @carlousa14 are buying Shopify, Inc SHOP.
Shopify is set to print its first-quarter earnings before the market open on Thursday. When the Ottawa-based e-commerce company reported its fourth-quarter earnings on Feb. 16, the stock gapped down over 10% the following day and slid an addition 6% intraday. For that quarter, Shopify reported EPS of $1.36, which missed the consensus estimate of $1.58.
Heading into the event, a number of analysts have weighed in on the stock: On Monday, Keybanc maintained an Overweight rating on Shopify but lowered its price target to $650; on April 25, RBC Capital cut Shopify's price target from $1,300 to $1,000; and on April 19, Piper Sandler lowered its price target from $900 to $800. The lowest price target implies a 52% move to the upside.
Shopify, like many stocks in the tech sector, has been heavily beaten down over the past six months, plunging over 75% from its Nov. 19 all-time high of 1,762.92 to a low of $426.82 on Friday. The stock hasn’t trade at the current price since April of 2020, when Shopify first began to recover from the decline brought on by the COVID-19 pandemic.
The reaction to Shopify’s earnings print may become the deciding factor as to whether the bottom is in for the stock or if Shopify will continue to plummet, possibly losing support at the psychologically important $400 level. From a technical standpoint, at least a bounce is likely to come heading into the earnings event.
Want direct analysis? Find me in the BZ Pro lounge! Click here for a free trial.
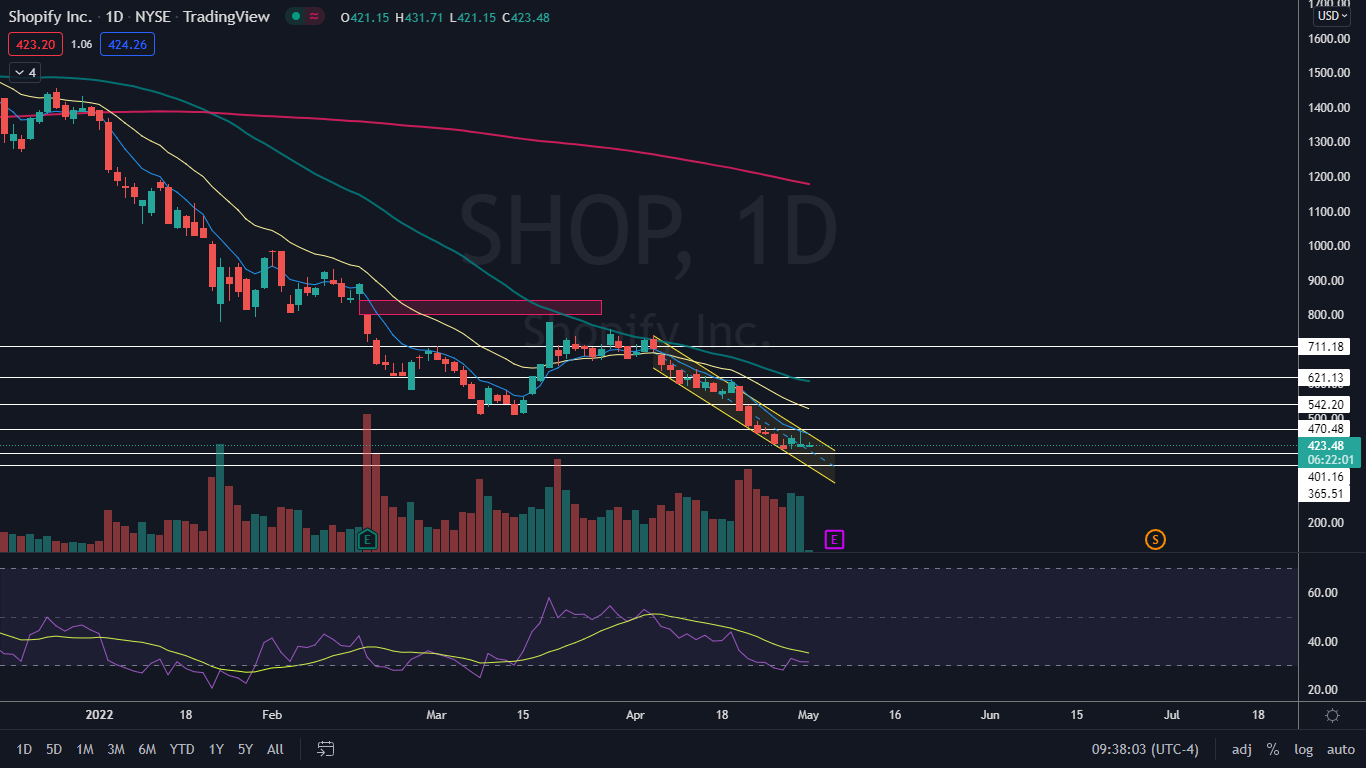
The Shopify Chart: On April 5, when Shopify topped out at $741.34, the stock entered into a downtrend, making consistent series of lower lows and lower highs. Shopify’s most recent lower high was printed on April 19 and the $614 mark and the most recent lower low was formed at the $413.32 level on April 26.
Shopify’s downtrend has taken place between two parallel lines, which has set the stock into a falling channel on the daily chart. The pattern is considered to be bearish until a stock breaks up bullishly from the upper descending trendline of the pattern on higher-than-average volume, which can indicate a large reversal to the upside is in the cards.
Shopify has a gap above between the $800 and $843.14 levels. Gaps on charts fill about 90% of the time, which makes it likely Shopify will trade up into the empty range in the future, although it could be some time before that happens considered the stock is currently trading about 50% below the area.
A bounce, at least to the upper trendline of the channel, is likely to happen over the coming days because Shopify’s relative strength index (RSI) is measuring in at about 32%. When a stock’s RSI falls toward the 30% level it becomes oversold, which can be a buy signal for technical traders.
- Bulls want to see big bullish volume come in and break Shopify up from the falling channel, which will allow the stock to regain support at the eight-day exponential moving average. Shopify has resistance above at $470.48 and $542.20.
- Bears want to see Shopify continue to trend lower in its downtrend until the stock loses support at $400. Shopify has support below at $401.16 and $365.51.
© 2024 Benzinga.com. Benzinga does not provide investment advice. All rights reserved.
Comments
Trade confidently with insights and alerts from analyst ratings, free reports and breaking news that affects the stocks you care about.

