Traders often rely on Japanese candlestick charts to observe the price action of financial assets. Candlestick graphs give twice as much information as a standard line chart. They also allow you to interpret stock price data in a more advanced way and to look for distinct patterns that provide clear trading signals.
What are Japanese Candlesticks?

Japanese candlesticks are chart units that display price action for a given period.
Each candlestick represents a specific timeframe and gives data about the price’s open, high, low and close during the period.
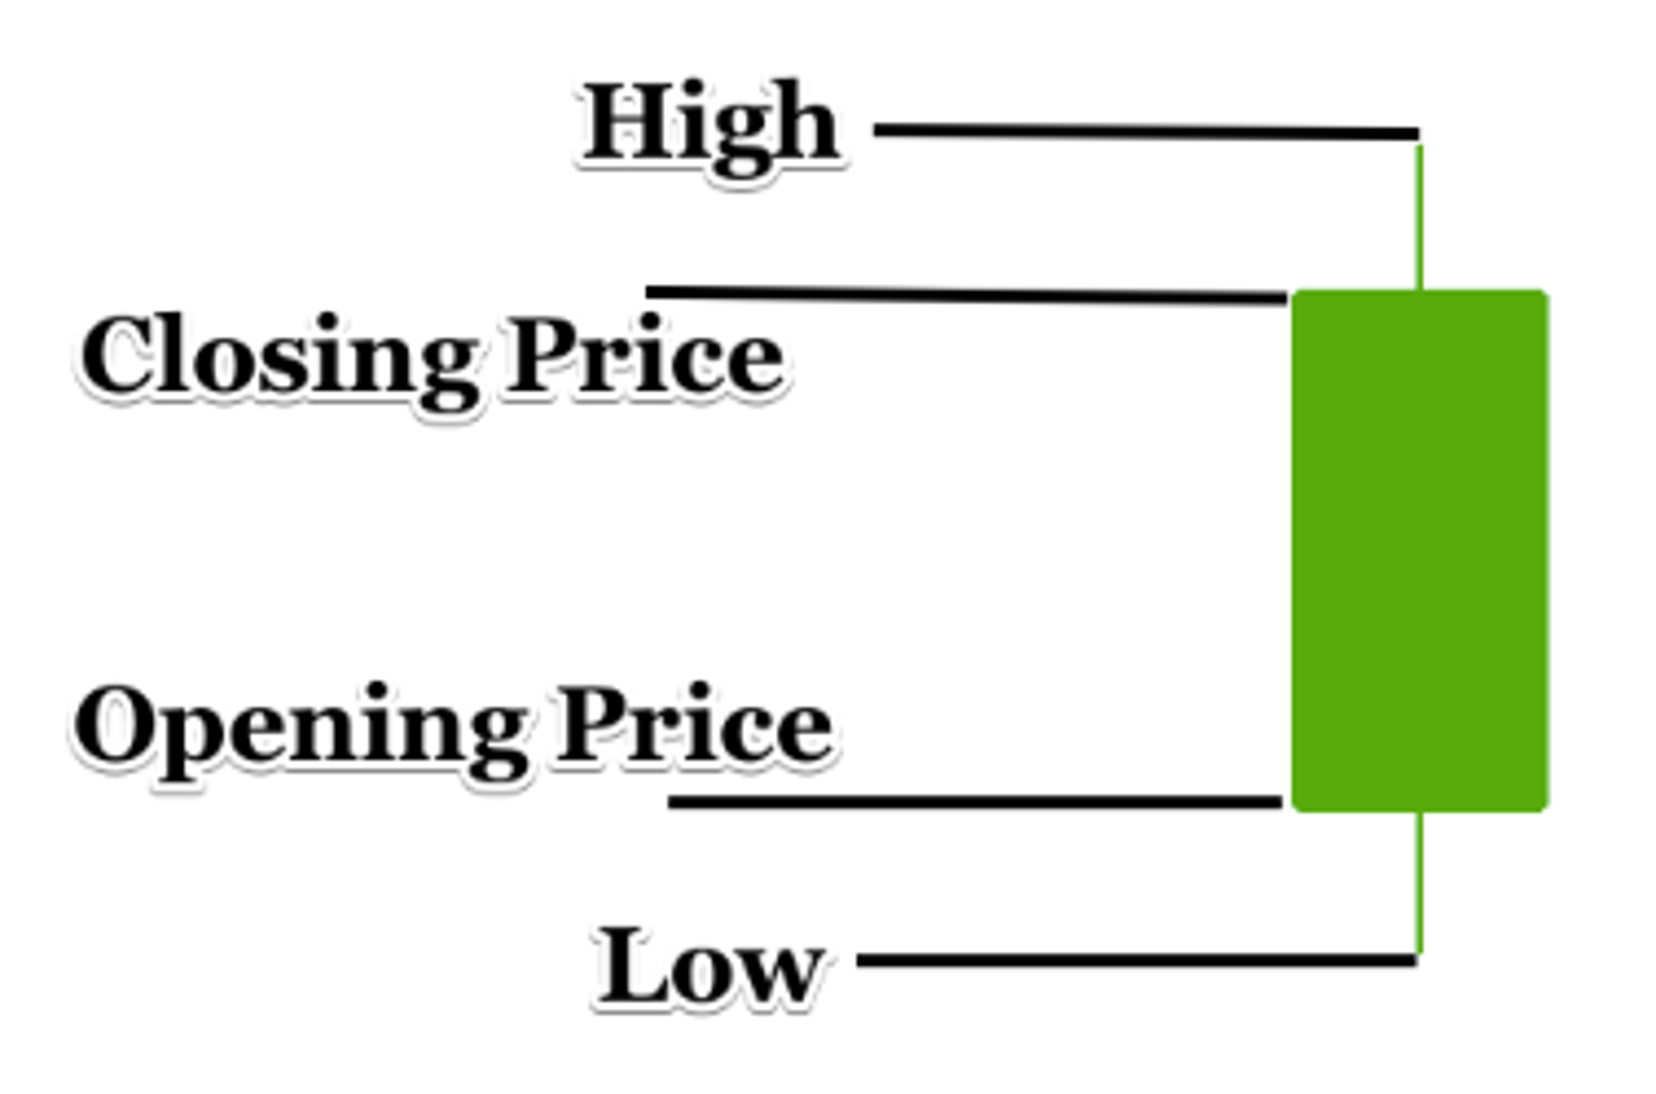
Each candlestick represents a specific timeframe. It gives information about the asset’s opening, high, low and closing price during the period. Standard candlesticks consist of a candle body plus an upper and lower wick.
The candle body extends from the closing price to the opening price of an asset for a particular period. The tip of the upper wick of the candle shows the highest price attained during the period. The candle’s lower wick starts at the lowest price seen during the period and rises up to the body of the candle.
Bullish vs. Bearish Candles
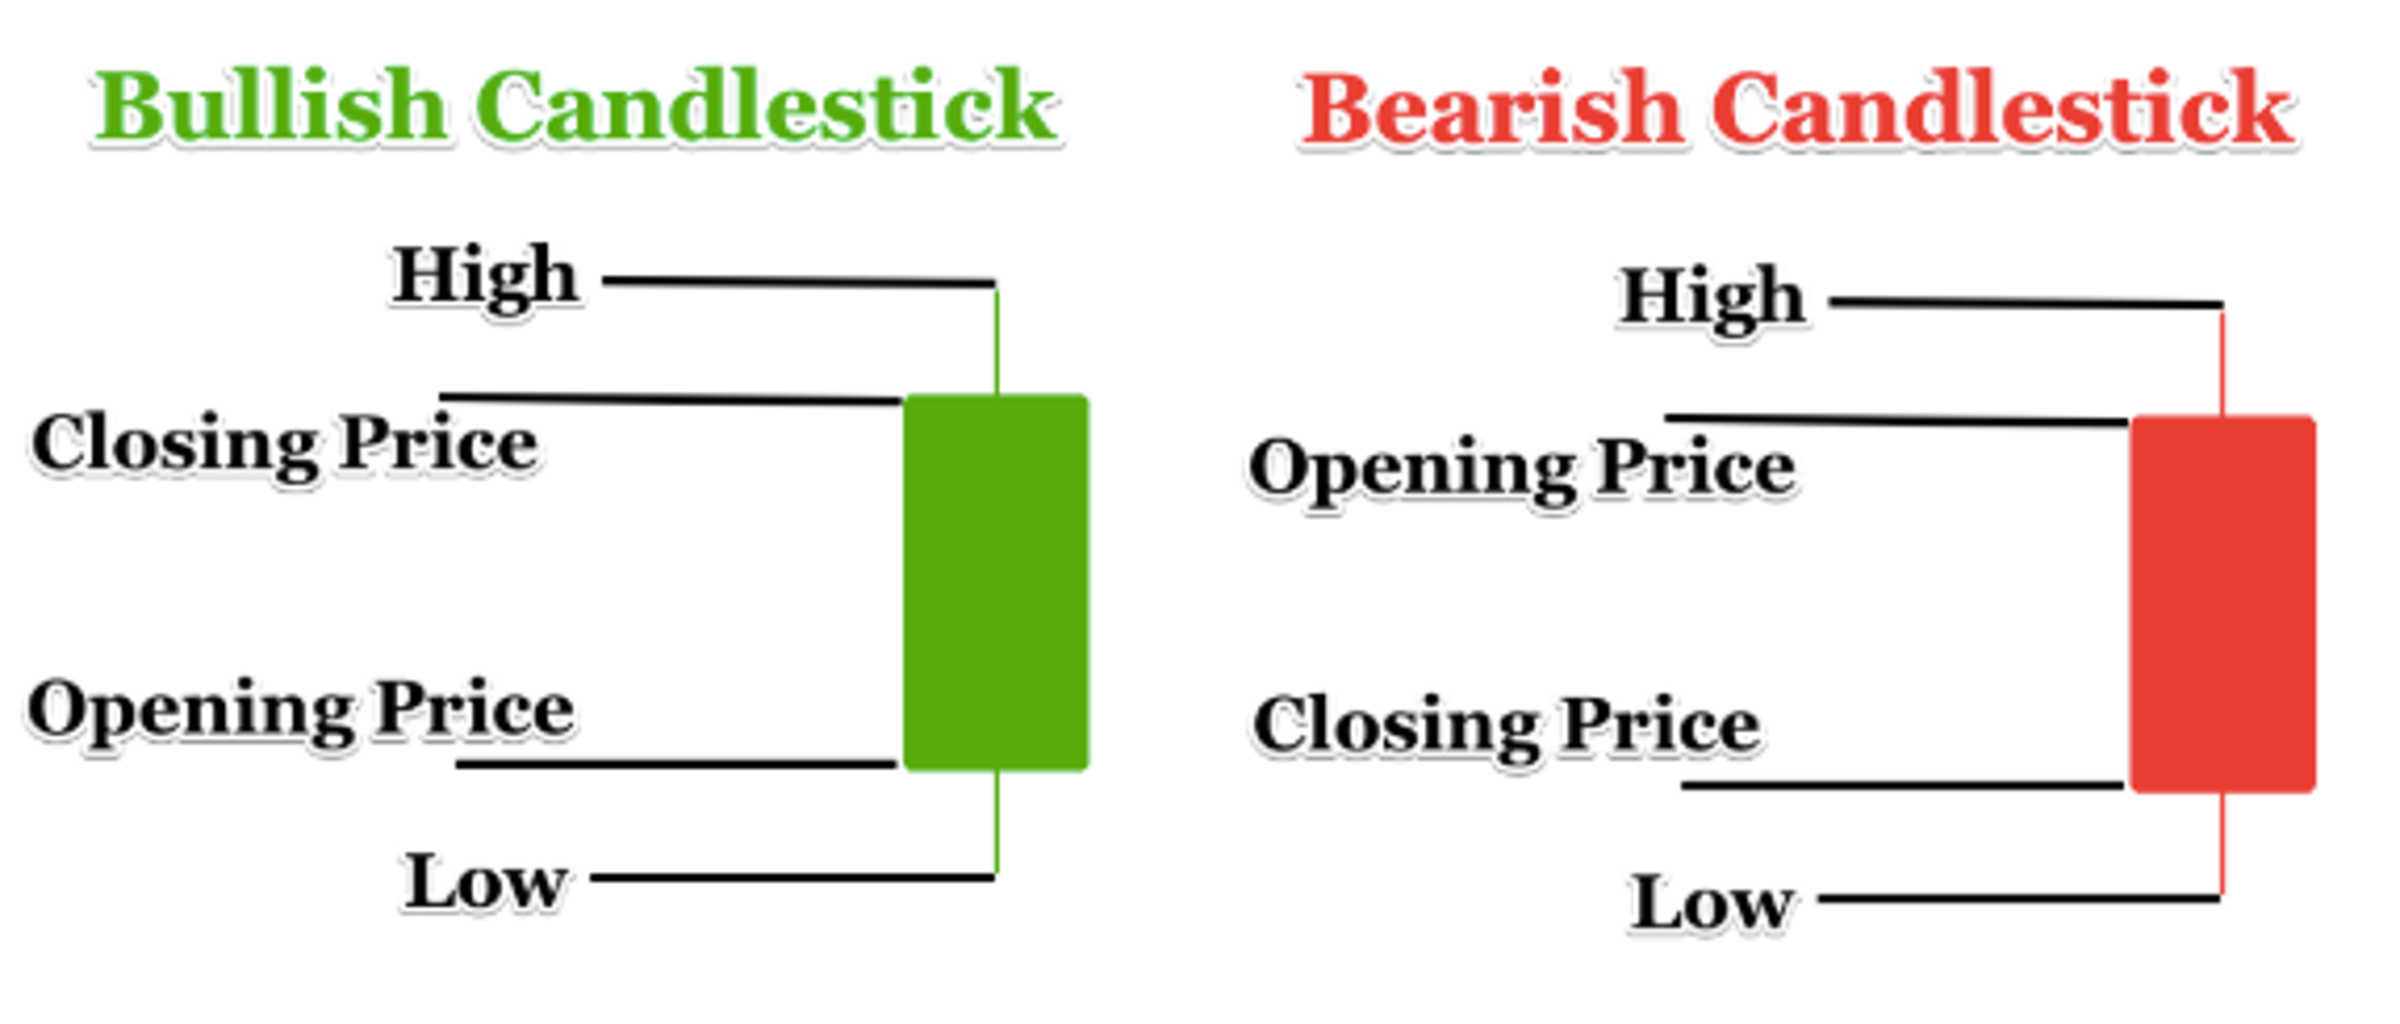
Candles are bullish or bearish depending on the direction of the price during the period they are drawn for.
Bullish Candlestick
A bullish candlestick forms when the price opens at a certain level and closes at a higher price. This type of candlestick represents a price increase over the period in question. The default color of a bullish Japanese candlestick is green, although white is also often used.
Bearish Candlestick
A bearish candlestick forms when the price opens at a certain level and closes at a lower price. This candlestick shows a price drop. The default color of the bearish Japanese candle is red, but black is also popular.

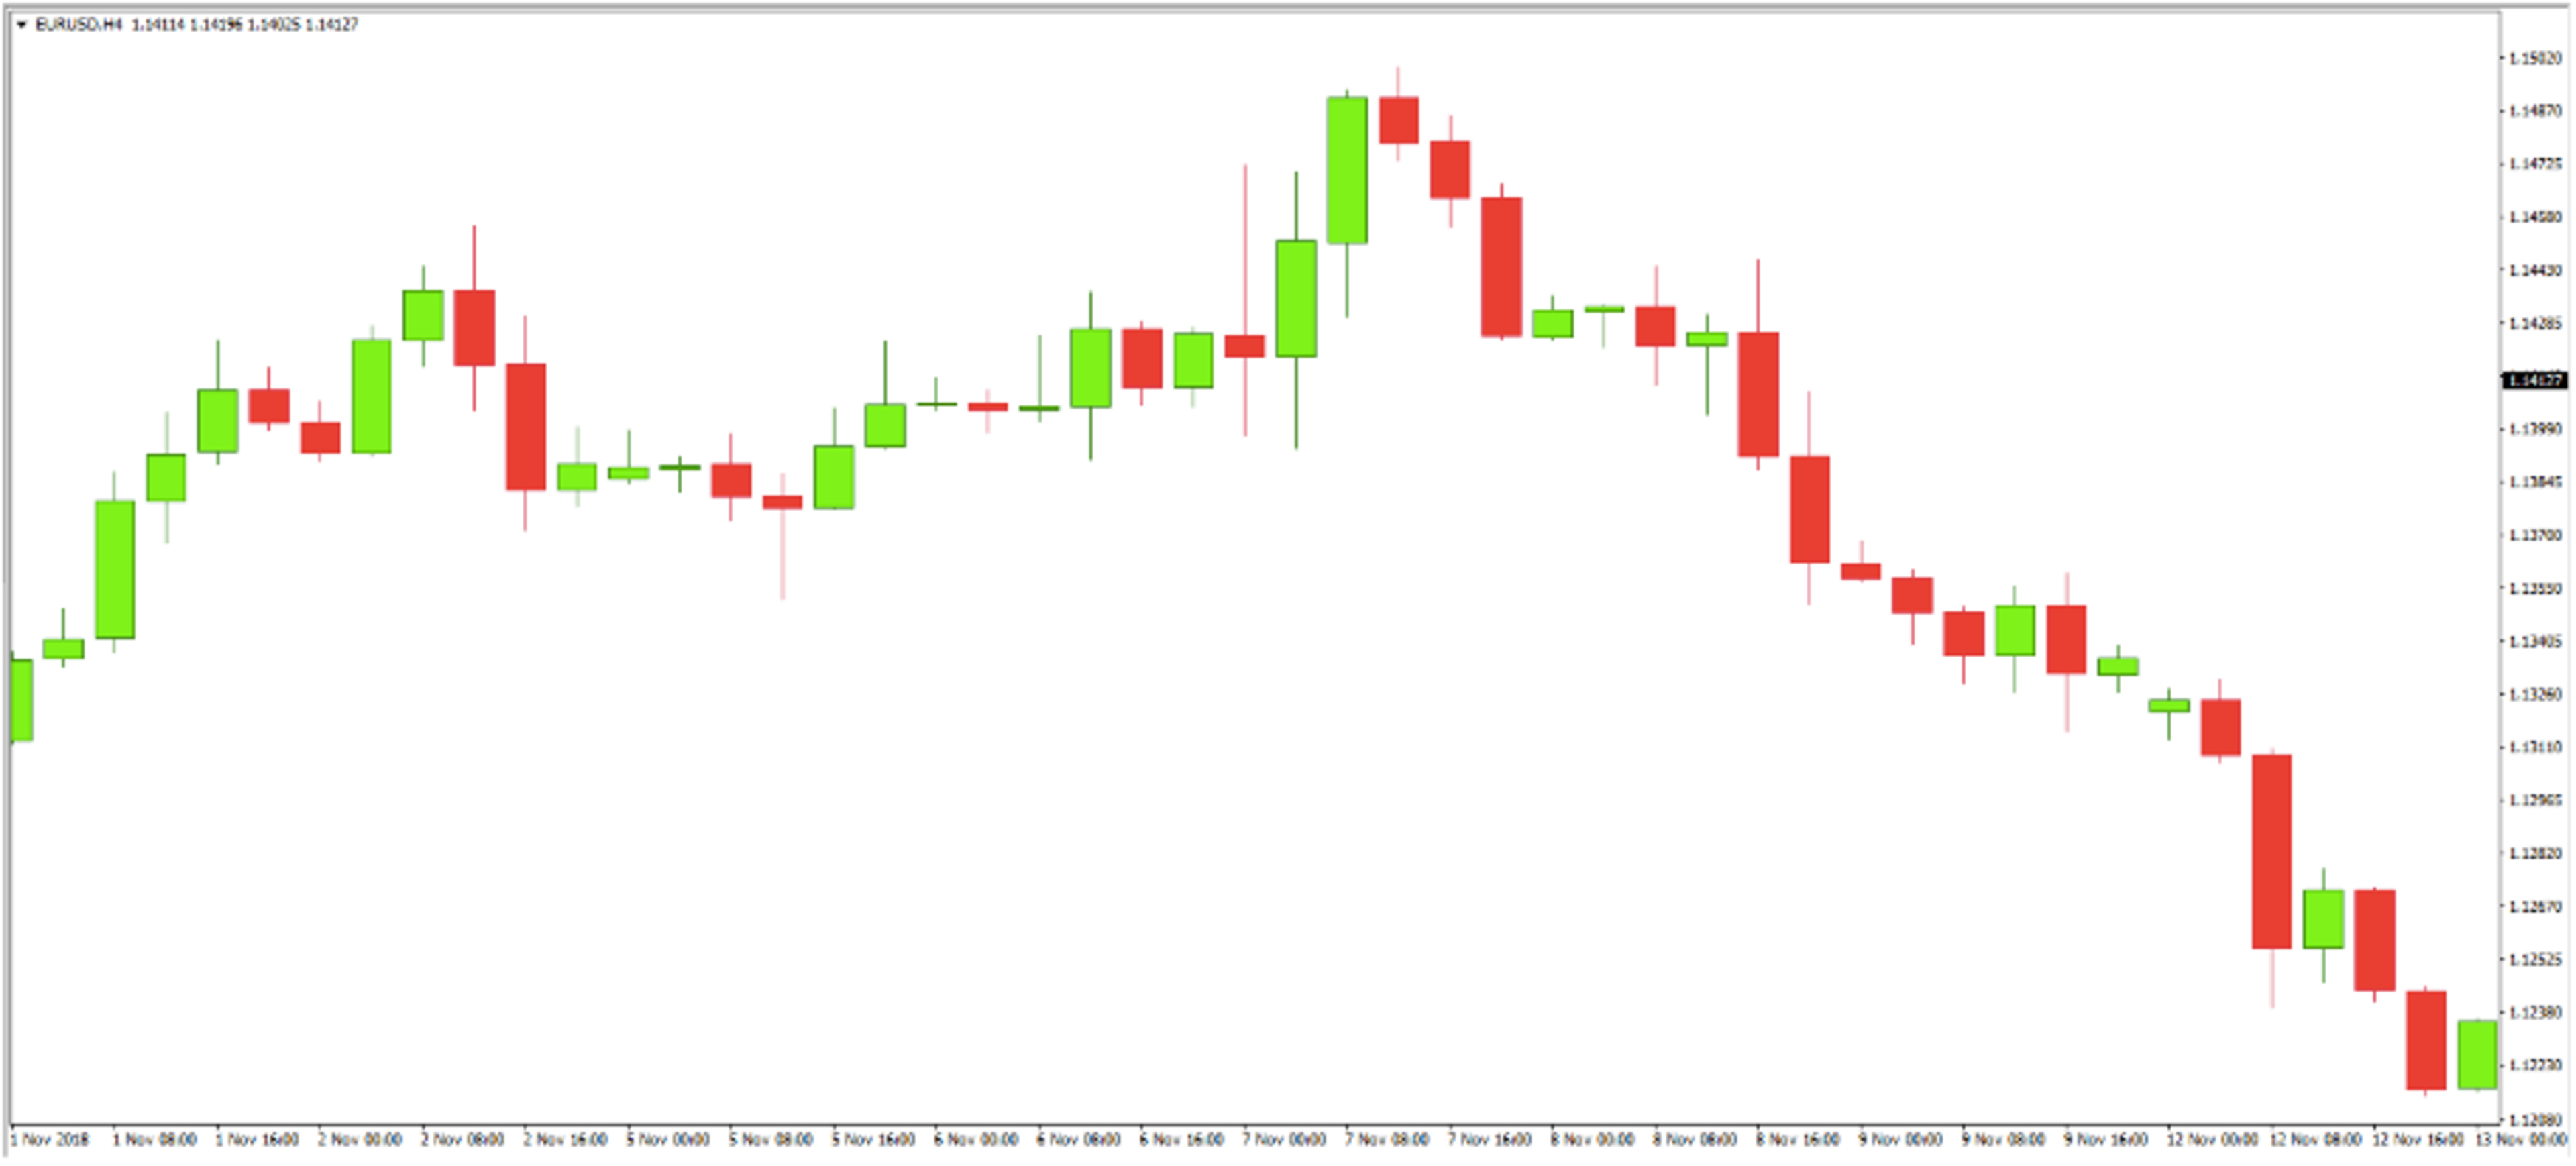
As an asset’s price is plotted over time using Japanese candlesticks, they form a Japanese candlestick chart of many candlesticks. The graph you see below is a 4-hour candlestick chart where each of the candlesticks represents a 4-hour period.

You can use many different chart timeframes or periods to plot candlestick charts in your technical analysis system or trading platform. The most common are:
- 1-minute (M1)
- 5-minute (M5)
- 15-minute (M15)
- 30-minute (M30)
- 1-hour (H1)
- 4-hour (H4)
- Daily (D1)
- Weekly (W1)
- Monthly (M1)
The smaller the timeframe you use, the closer you look into the price action of the asset. It’s like you are zooming into the chart. Let’s say you are looking at an H4 chart like the one shown above. When you switch to the H1 chart, you will have 4 times more candles. Each H4 candle period expands into 4 H1 candles.
Now, let’s get back to the H4 chart. Let’s say you switch to a daily or D1 chart, where each candle represents 24 hours. Every 6 H4 candles get grouped into a single D1 candle. You will feel like you are zooming out of the price action as you increase the time period of your candlestick chart.
Types of Candlestick Patterns
Candles are constructed from four prices, specifically the open, high, low and close. They form different shapes and combinations commonly known as candlestick or candle patterns. Candle patterns can be single, double or triple patterns that consist of one, two or three candles respectively.
Single Candle Pattern
A single candle pattern involves only one candlestick. The more famous single-candle patterns are:
- Hammers: the hammer, inverted hammer, hanging man and shooting star
- Doji
- Spinning top
- Spinning bottom
- Bullish marubozu
- Bearish marubozu
Double Candle Pattern
Double candle patterns consist of two Japanese candlesticks. The more famous double candle patterns are:
- Bullish engulfing
- Bearish engulfing
- Bullish harami
- Bearish harami
- Tweezer top
- Tweezer bottom
Triple Candle Pattern
Triple candle patterns are formed from three candlesticks. Some of the more well-known triple candle patterns include:
- Morning star
- Evening star
- 3 white soldiers
- 3 black crows
What Common Candlestick Patterns Mean
Each candlestick pattern has a specific interpretation that reflects the attitude of market participants. The patterns can also provide trading signals since traders tend to act similarly in the same situations.
1. Doji Candlestick

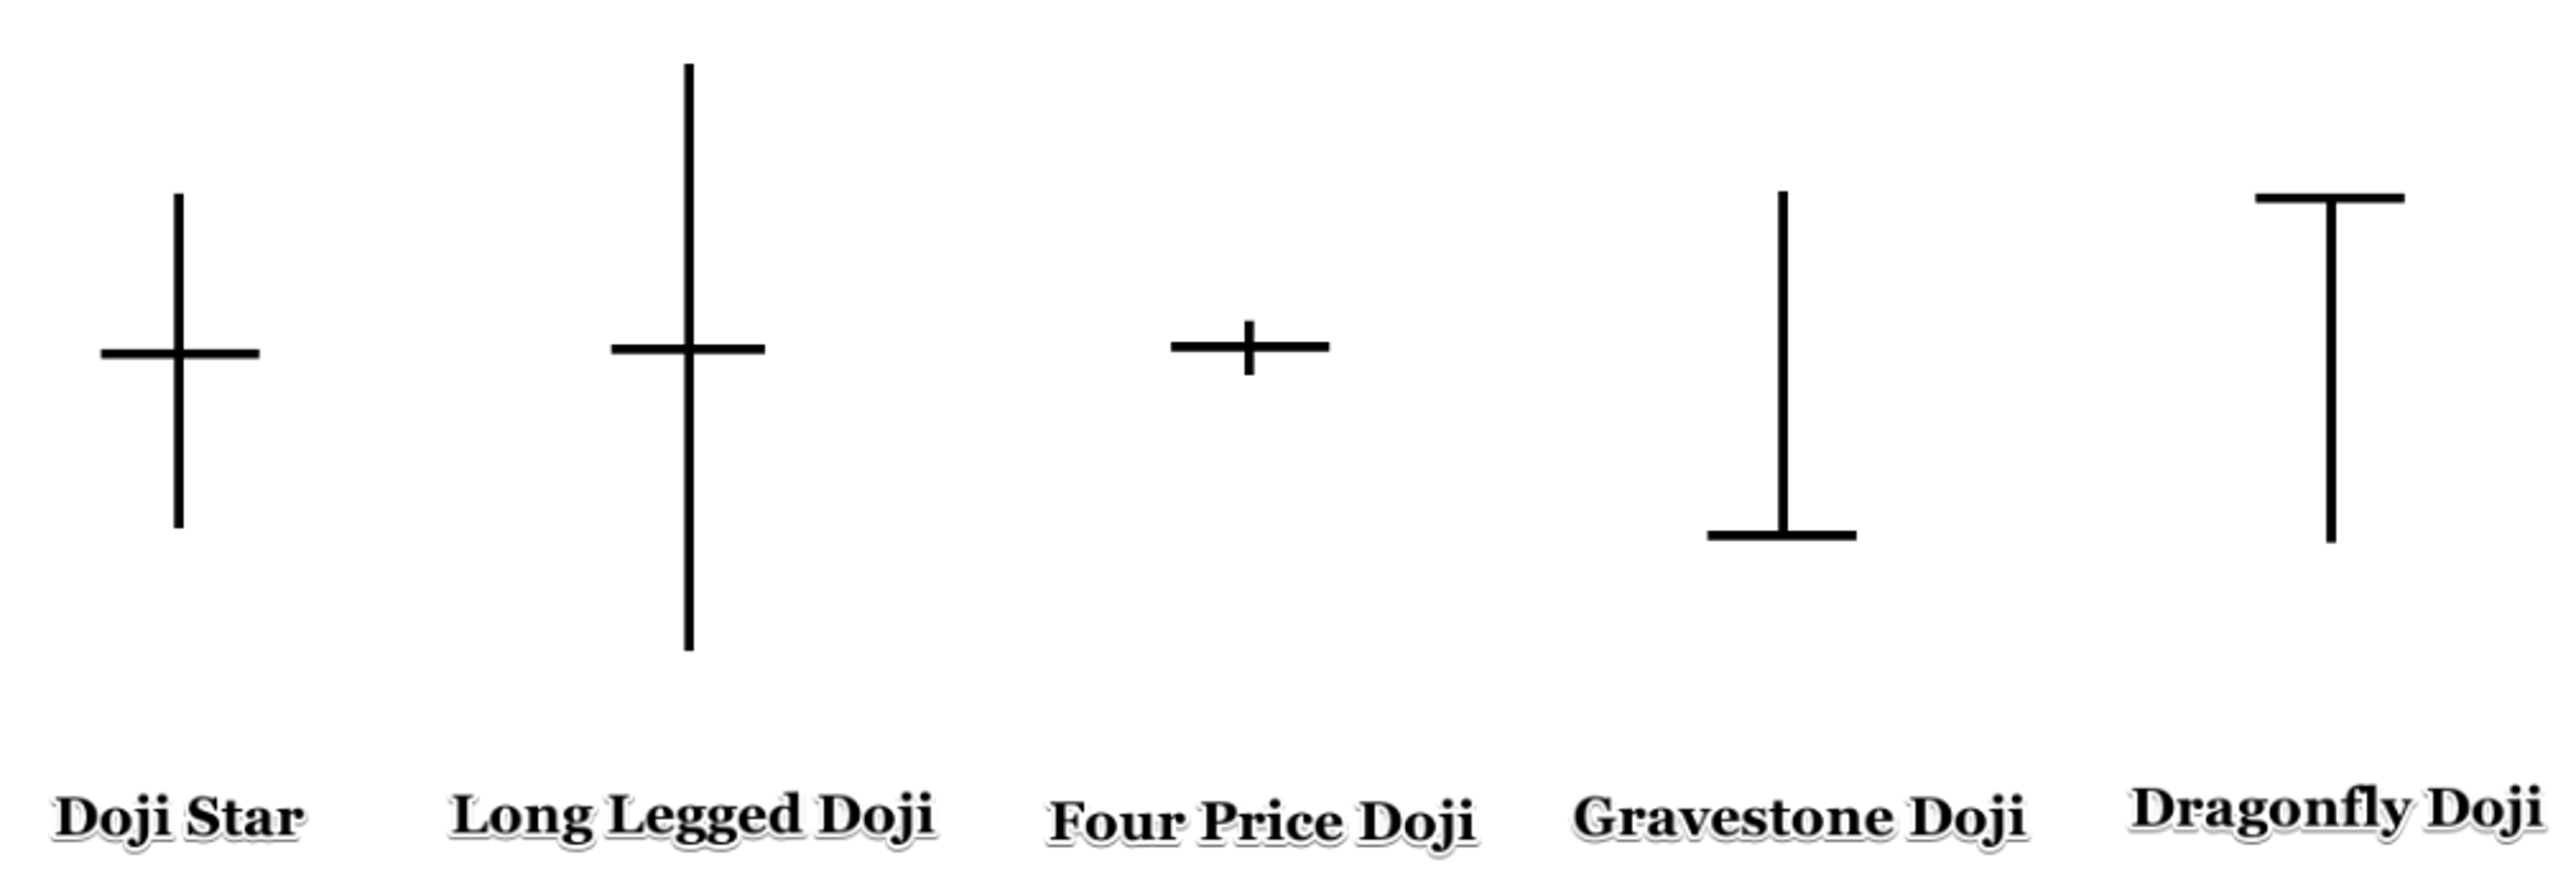
The doji is a single-candle pattern. It is the only candlestick that is neither bearish nor bullish. The doji represents a neutral state where the price closes exactly where it has opened. For this reason, the doji has no candle body and it looks like a dash.
Why is the price closing exactly where it opened? Because the bullish and bearish pressures in the market have reached equilibrium. Since these forces on the price are roughly equal, it is likely that the previous trend will end. This situation could bring about a market reversal, which is a price move contrary to the preceding trend.
Seeing the doji candle will often indicate an upcoming price reversal.
2. Hammer Candlestick Family
The hammer candlestick family also consists of related single candlestick patterns. Hammers have a long upper or lower wick and a small candle body on the opposite side. Like the doji, a hammer candlestick pattern indicates that a price reversal might be on its way. Members of the hammer family of candlesticks include the following.

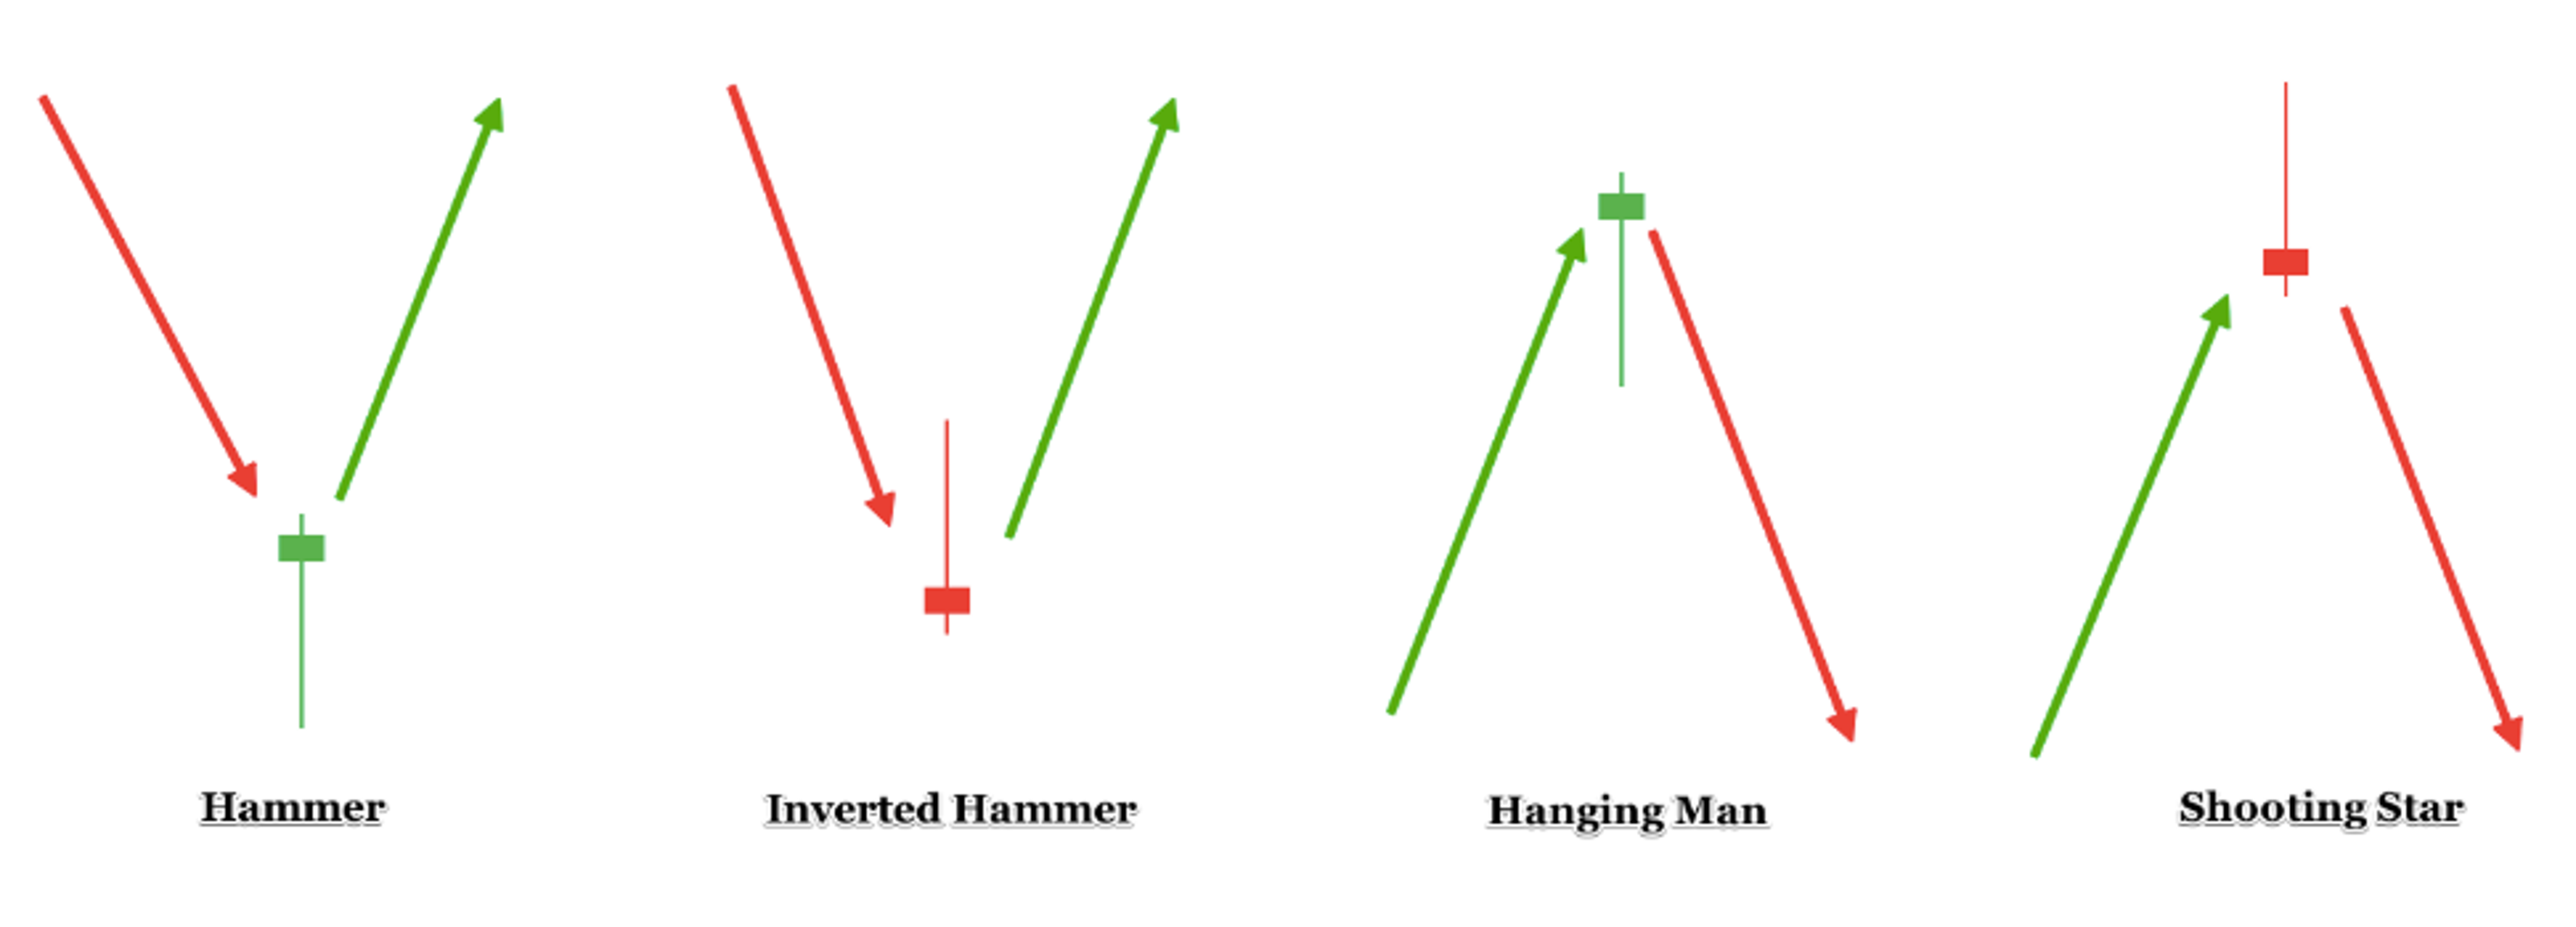
Hammer
A hammer candle will have a long lower candlewick and a small body in the upper part of the candle. Hammers often show up during bearish trends and suggest that the price might soon reverse to the upside.
Inverted Hammer
The inverted hammer has a long upper candlewick and a small body in the lower part of the candle. Like the hammer, an inverted hammer appears during bearish trends. It suggests a price reversal.
Hanging Man
The hanging man looks the same as the hammer, but it appears during bullish trends and suggests that a correction to the downside might soon materialize.
Shooting Star
The shooting star has the same structure as the inverted hammer. When it appears during bullish trends, it indicates that the recent rise could stop and the market will start correcting lower.
This image will give you a better idea of the hammer candle family. The green arrows represent moves higher while the red arrows represent price declines.
The candle might look the same, but the previous trend and its direction give different signals. Notice that each candle pattern in the hammer family is a reversal pattern that could be bearish or bullish depending on what directional move preceded it.
3. Engulfing Candlestick Patterns
Engulfing candlestick patterns are double candle patterns. They consist of a random candle and another bigger candle that fully encompasses or engulfs the price action contained within the first.
Bullish Engulfing Pattern
The bullish engulfing pattern appears during bearish trends. It consists of a bearish candle followed by a bullish candle that engulfs the first candle. This pattern suggests a bullish move will soon occur.
Bearish Engulfing Pattern

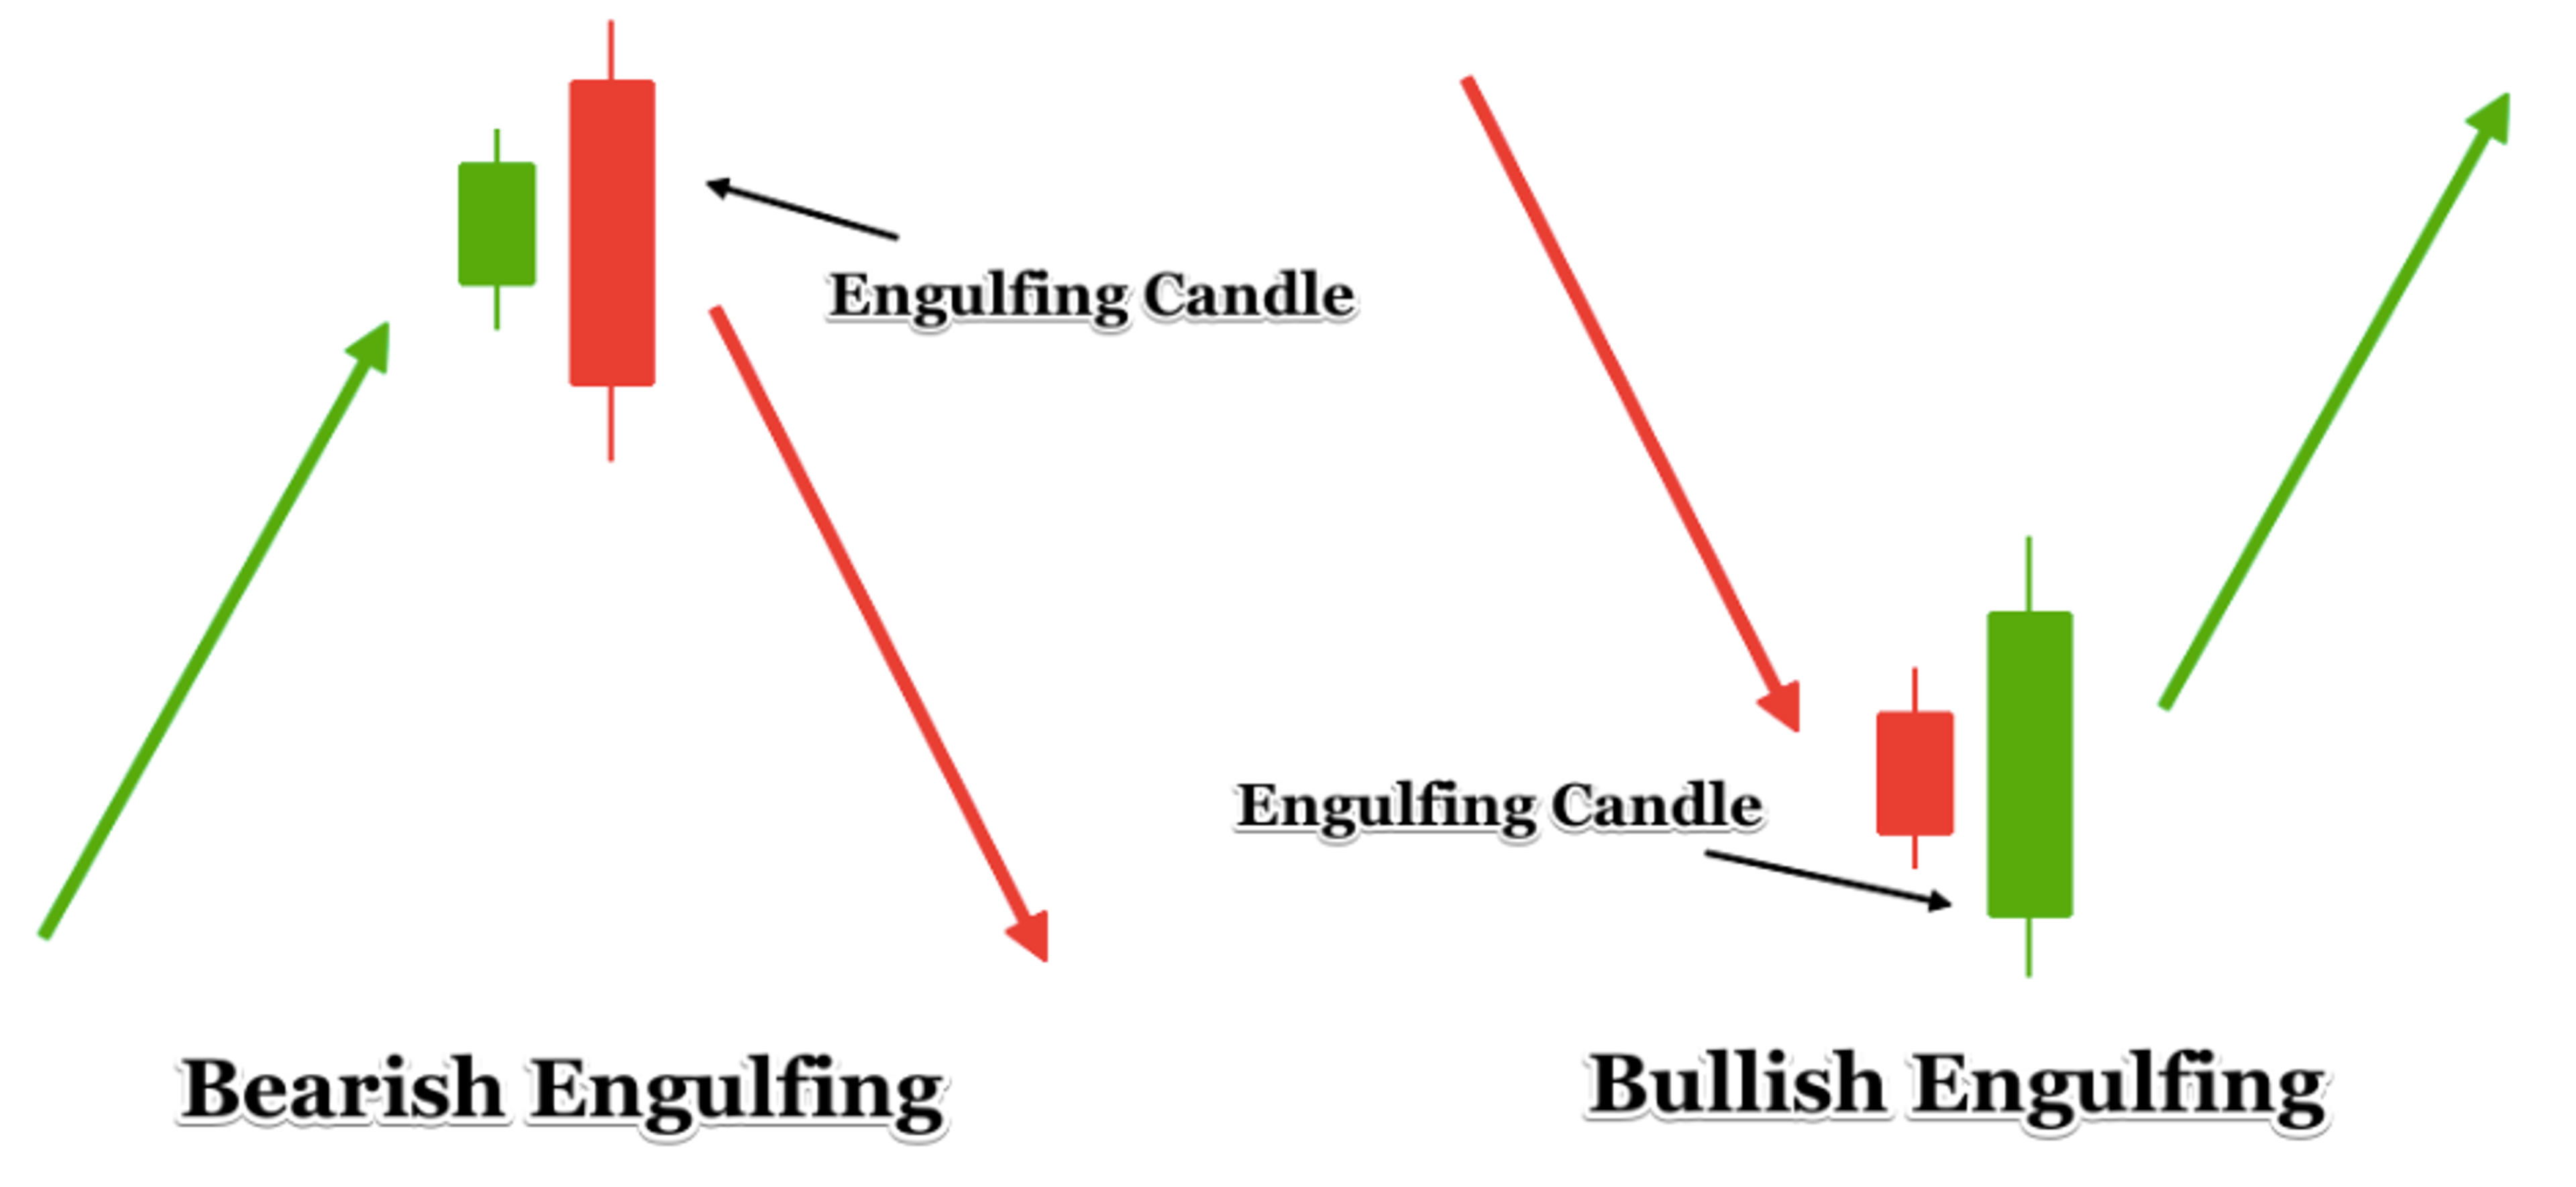
The bearish engulfing pattern appears during bullish trends. It consists of a bullish candle, followed by a bearish candle that engulfs the first candle. This pattern indicates a bearish move may soon be forthcoming.
4. Morning and Evening Star Candlestick Patterns
The morning and the evening star are triple candle patterns. They also forecast reversals.
Morning Star
The morning star pattern occurs during bearish trends and signals an upside reversal. It starts with a bearish candle and is followed by a small bearish or bullish candle that gaps down. Then the price gaps up and forms a bigger bullish candle. The third candle of the pattern should cover at least half the body size of the first candle.
Evening Star

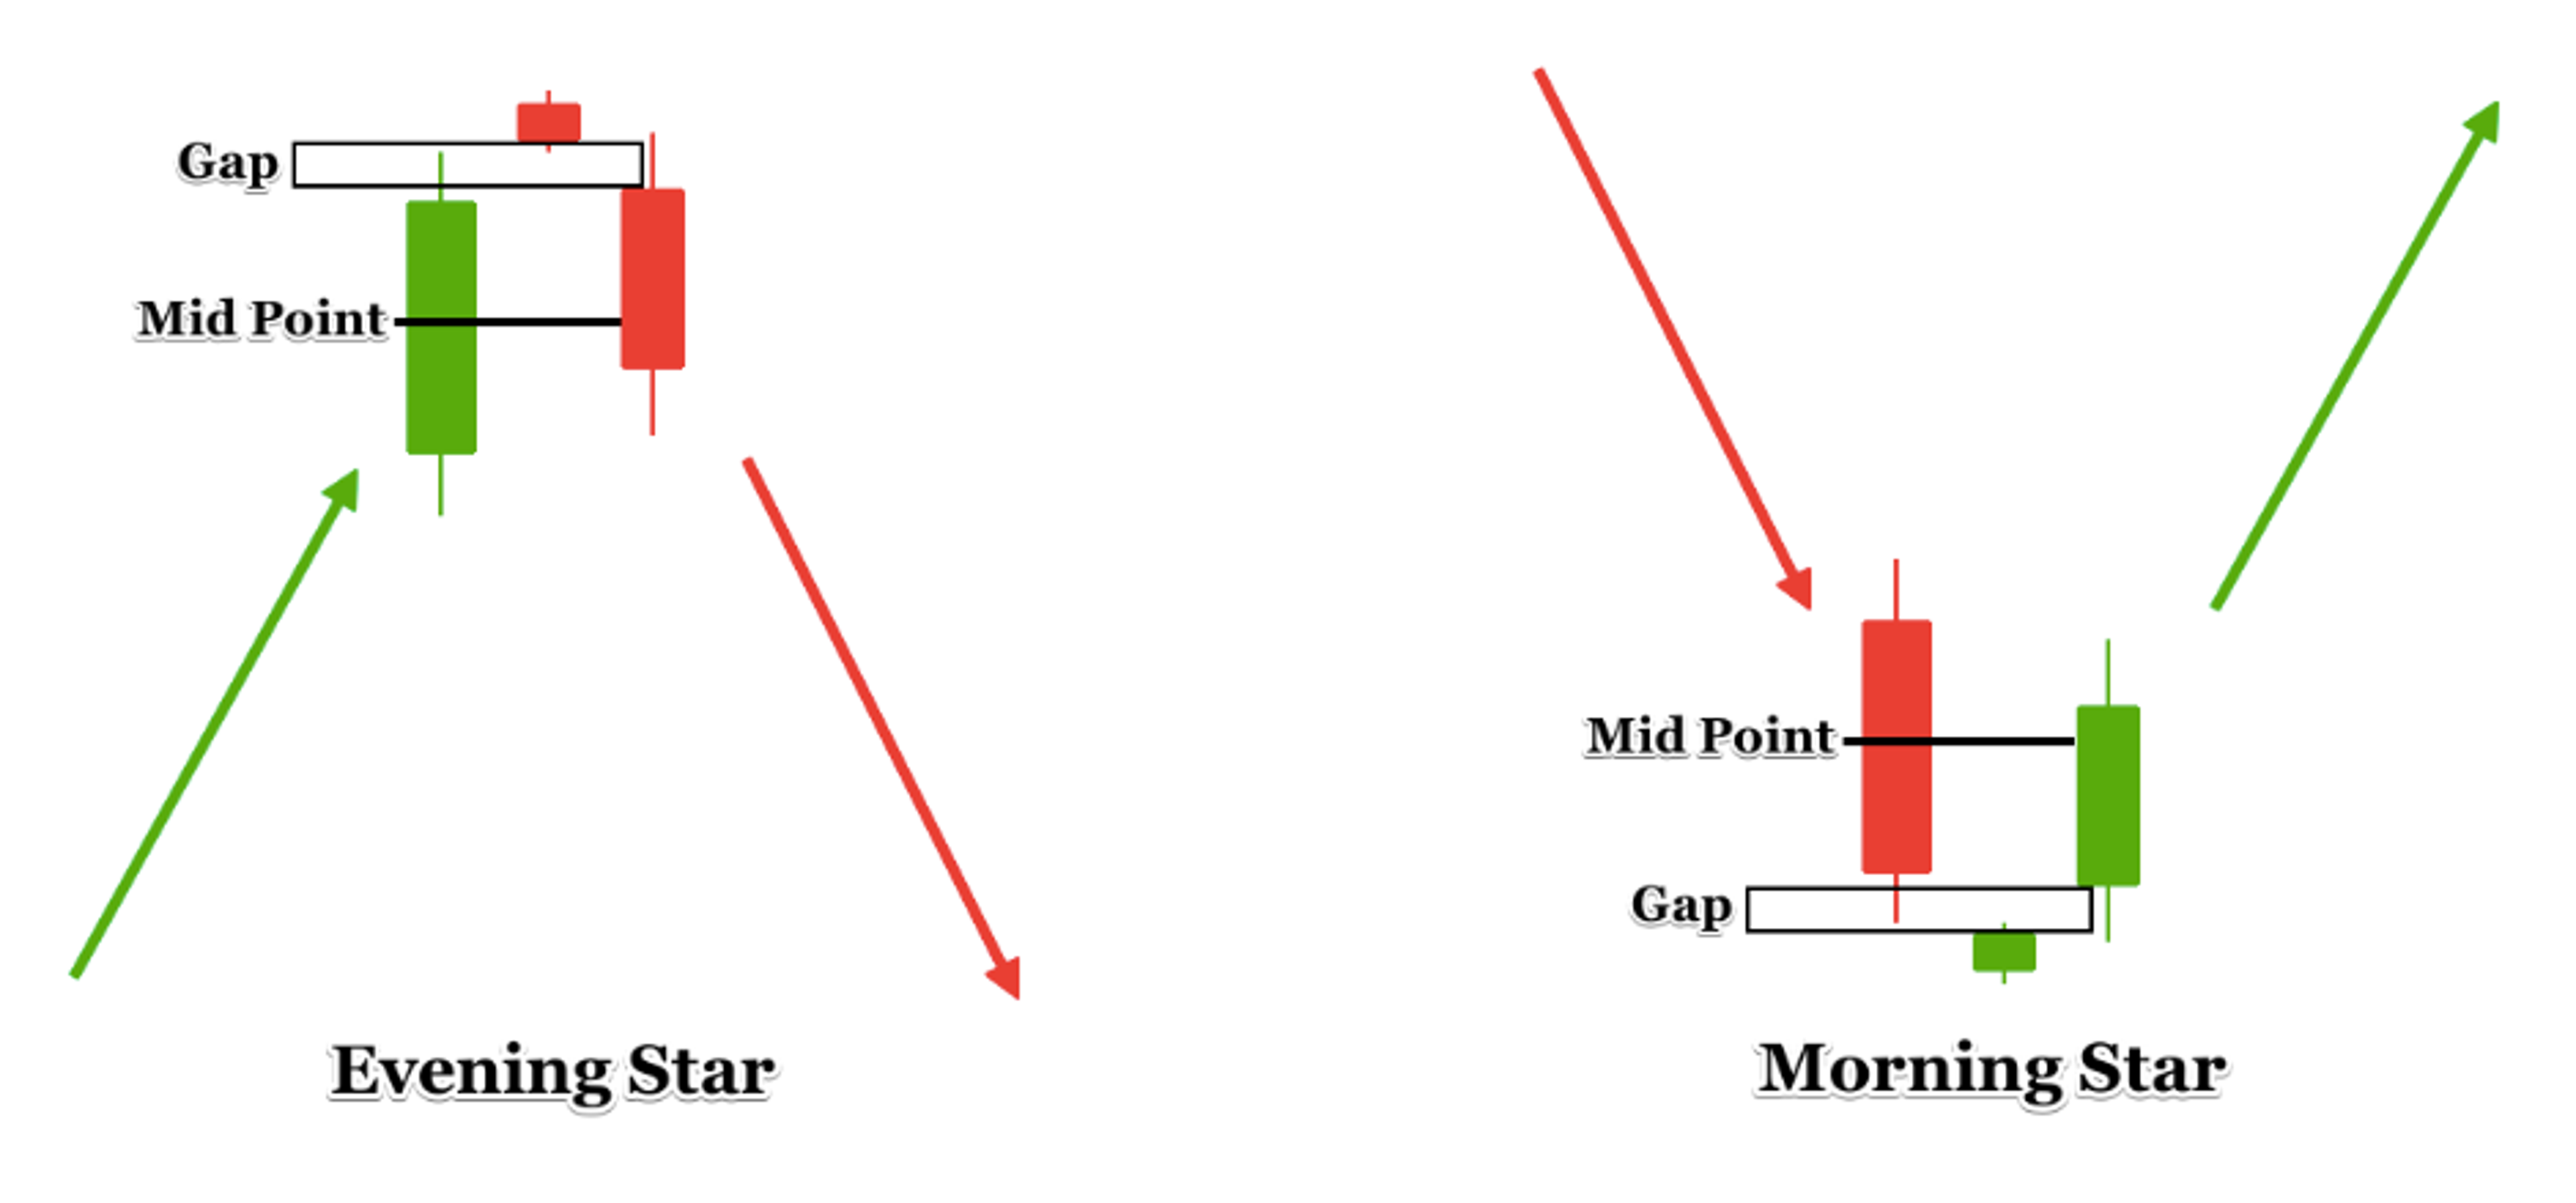
The evening star is the opposite of the morning star. It appears during bullish trends and signals a downside reversal. The pattern starts with a bullish candle, followed by a small bearish or bullish candle that gaps up. Then the price gaps down and forms a bigger bearish candle. The third candle should cover at least half the body size of the first candle.
Tip From a Pro
Benzinga got top trader Ezekiel Chew, who makes six figures a trade and trains the bank traders behind the scenes, to share tips about candlestick reading and what it takes to be successful in forex trading.
Crew believes there are three key aspects to successful candlestick reading.
1. Memorize the important ones: It’s not easy to memorize all the candlestick patterns right from the start — concentrate on the important ones, like the doji and the bullish and bearish bars. The next time you see them, you will know what they mean and how to anticipate the next market movement.
2. Understand the meaning behind each bar: When you memorize the candlestick patterns, you also need to know what’s the rationale behind them. For example, if the price is going sideways for a while and forms a big bullish bar, it shows that the buyers have taken over and it’s likely that it will start moving upwards from there for the next few bars.
3. Apply them as an extra confirmation: No successful trader uses just one piece of information. It doesn’t mean that when you see a doji, the market will immediately change its direction. You use them as an add-on confirmation to a setup or strategy. Candlestick patterns can help in identifying early movement and changes in the market. But they should not be used solely on their own and enter a trade every time you see a doji.
Most of all, Crew has a famous trading mantra — “Win big, lose small” that he and his students abide by.
Crew says that “trading is all about having an edge in the game and knowing the mathematical probability behind each trade.” By winning big and losing small, a single win can potentially cover three or more losses. If you apply this methodology in the long run, you will be a winning trader.
To learn more about Crew’s method of trading backed by mathematical probability, you can check out his one core program.
Leverage TrendSpider


TrendSpider is a new-age charting and technical analysis platform designed specifically for active traders. You can:
- Automate routine grunt work like drawing trendlines and finding chart patterns
- Outsource chart monitoring to reduce chart staring and eye strain
- Test and refine trading strategies
- Automatically identify candlestick patterns on any chart
- Create powerful chart-based price alerts so you never miss an important price movement
Build Your Trading Strategy
Recognizing candlestick chart patterns is the first step toward understanding this useful and popular method of analyzing market price action. If you know what these patterns could mean and what signals they generate, it’ll help you build a more advanced trading strategy.
Many more patterns that range from simple to more complex exist, and you’ll probably encounter some of them over the course of your trading experiences. You could even discover a candle pattern of your own
Frequently Asked Questions
Should I consult other tools beyond candlestick charts?
Generally, yes. No candle pattern predicts the resulting market direction with complete accuracy. Whenever making trading decisions based on technical analysis, it’s usually a good idea to look for confirming indications from multiple sources.
Set aside some time to learn more about trading. If you are new to trading or have little time to devote to technical analysis, you can use social trading platforms to copy the transactions of successful traders. You can also enroll in online courses to expand and update your trading knowledge. Another great idea is to subscribe to trading news like BenzingaPro to get customizable market news and research.
How can I get started trading?
No single candlestick pattern is considered the most accurate, as its accuracy depends on factors such as market conditions and timeframe. Different patterns can provide insights into market trends, but they should be analyzed alongside other technical indicators for informed trading decisions.
What candlestick pattern is most accurate?
No single candlestick pattern is considered the most accurate, as its accuracy depends on factors such as market conditions and timeframe. Different patterns can provide insights into market trends, but they should be analyzed alongside other technical indicators for informed trading decisions.