


- Robinhood is trading in a confirmed uptrend, making a series of higher highs and higher lows.
- If the stock closes near the high-of-day, Robinhood will print a bullish kicker candlestick.
- Geopolitical tensions, Fed uncertainty, and fast-moving headlines are driving July volatility. See how Chris Capre is trading it—live Wednesday, July 2 at 6 PM ET.
Robinhood Markets, Inc HOOD gapped up to start Friday’s trading session and continued to run higher intraday, rising over 6% above Thursday’s closing price.
The trading platform on Friday launched a new stock market index made up of its top 100 customer holdings. Seventy-five percent of the index is weighted with large-cap stocks, with Tesla, Inc TSLA, Apple, Inc AAPL and Amazon.com, Inc AMZN holding the top three positions.
The index also holds GameStop GME and AMC Entertainment Holdings, Inc AMC, known to historically be favorites of Robinhood’s user base.
The launch of the index may have helped Robinhood to break up higher on Friday, but a bullish day in both the general markets and the crypto sector certainly helped.


Want direct analysis? Find me in the BZ Pro lounge! Click here for a free trial.
The Robinhood Chart: On Thursday, Robinhood broke up from a sideways trading pattern into which the stock fell Aug. 19. When the stock closed Thursday’s trading session at the high-of-day, Robinhood printed a bullish Marubozu candlestick, which indicated the stock was likely to trade higher again on Friday.
- If Robinhood closes Friday’s session near its high-of-day price, the stock will print a bullish kicker candlestick, which could indicate higher prices will come again on Monday. If Robinhood closes the trading day with a long upper wick, it could indicate the next higher high has been printed and a retracement is in the cards for next week.
- A higher low will eventually come because Robinhood is trading in a confirmed uptrend. The stock printed its most recent higher high on Sept. 2 at $9.85 and the most recent lower low was formed at the $9.35 mark the following day.
- Robinhood has resistance above at $12.77 and $17.08 and support below at $9.94 and $7.71.

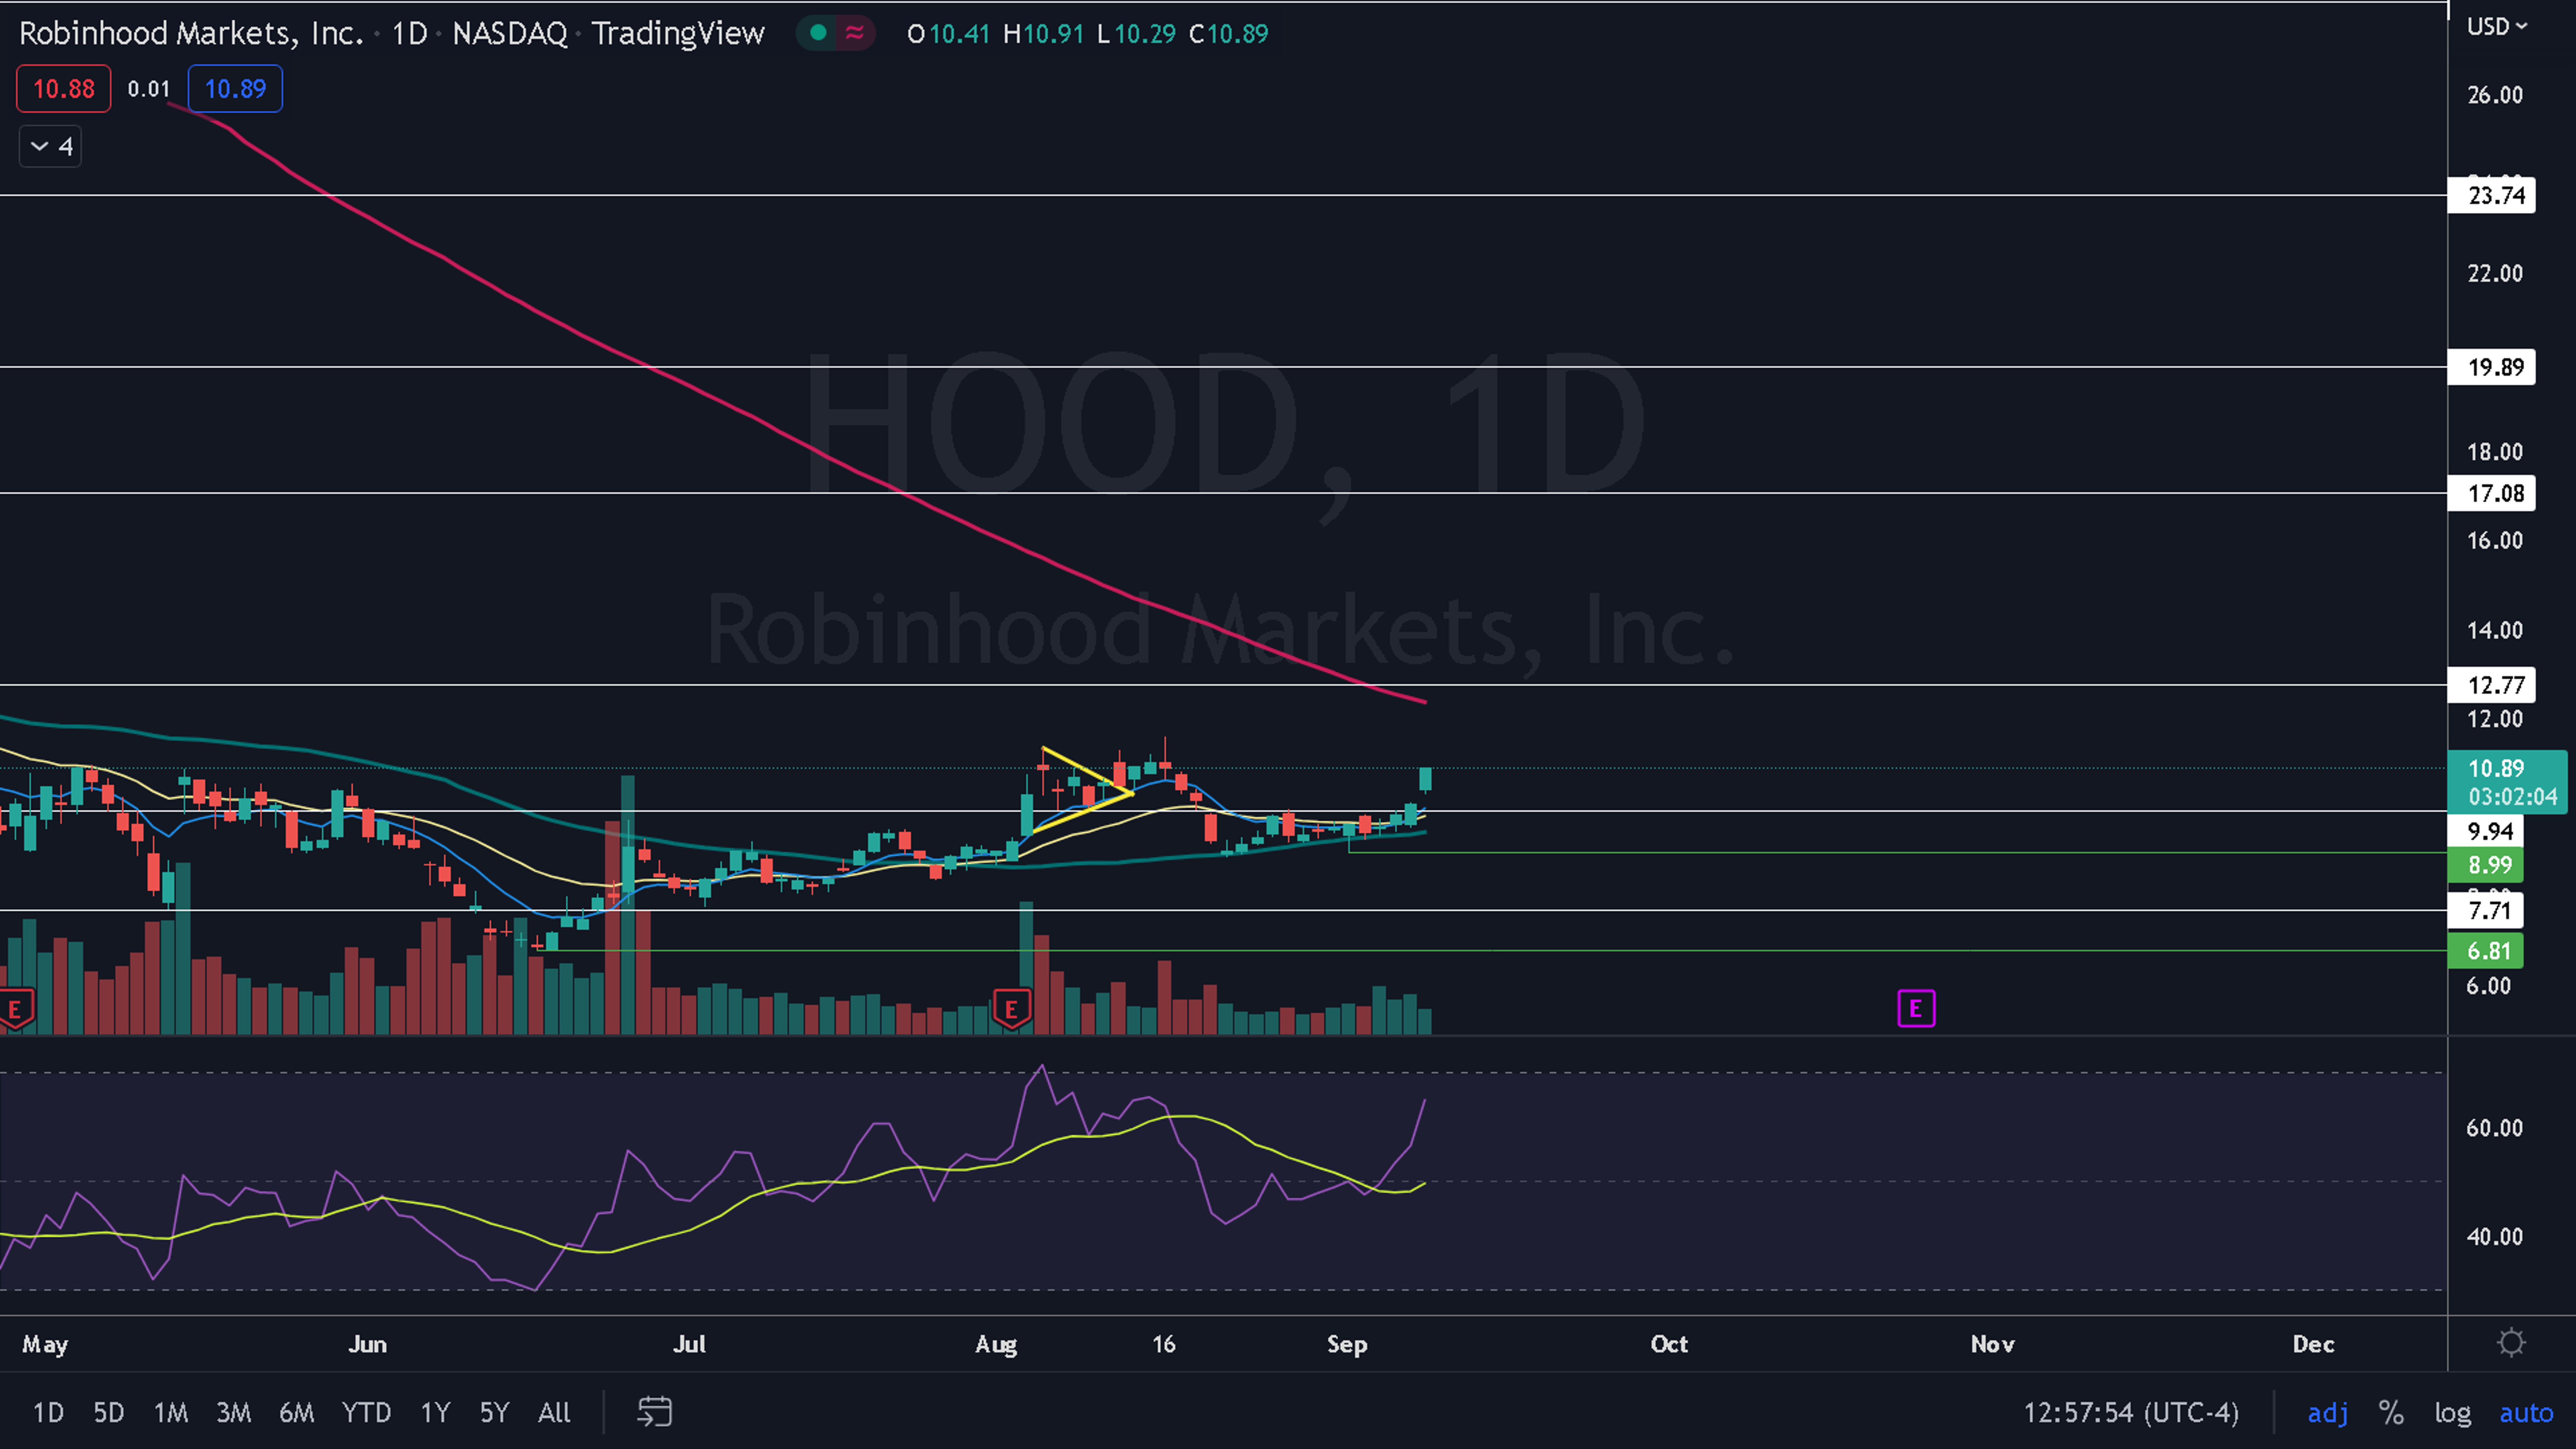
Photo courtesy of Robinhood.
Edge Rankings
Price Trend
© 2025 Benzinga.com. Benzinga does not provide investment advice. All rights reserved.
Trade confidently with insights and alerts from analyst ratings, free reports and breaking news that affects the stocks you care about.

