


(Thursday Market Open) If you crave a full menu of data and earnings, today’s the banquet you’ve been waiting for.
Morgan Stanley MS and Bank of America Corp. BAC rounded out the big bank results this morning, followed by retail sales and weekly jobless claims. Major indices have a weaker tone in the early going, hurt by a sharp 4% drop in Shanghai stocks. What could be interesting is to see if the market bounces back from this early weakness. That’s been the pattern lately on days where stocks have started lower.
Shanghai struggled today despite China reporting a 3.2% rise in Q2 gross domestic product (GDP). Even though GDP looked good, the retail sector there isn’t doing well. That’s one reason why the U.S. market is selling off this morning.
You could argue that strength in China’s markets helped set off the most recent leg of this long U.S. rally, though plenty of other factors contributed. It’s fantastic to see China’s economy back in growth territory, because in the long run—if the retail sector shows life—that could mean fresh demand for U.S. products. That’s also assuming trade tensions stay simmering and don’t go full boil.
Not much help from jobless claims this morning. They stayed stuck at 1.3 million, right about where they were last week and slightly above analysts’ consensus. That’s been a stubborn metric and indicates plenty of pain still in this struggling economy. Retail sales for June rose 7.5%, which is even better than it looks if you consider it was compared to a revised 18.2% May number and above expectations for around 5%.
The question—like a lot of the questions surrounding this economy—is whether things level off for retailers this month as the pace of reopenings slows amid a rise in virus cases. Stay tuned.


Mixed Bag for Banks as Weak Net Interest Weighs
Today’s bank results were kind of a mixed bag, with BAC shares falling nearly 3% in pre-market trading as the company set aside $4 billion more in reserves for potential credit losses. That ate into profit in a big way, though BAC’s earnings per share of $0.37 still beat analysts’ expectations of $0.27. Revenue of $22.5 billion slightly beat consensus views for $22.01 billion.
Net interest margin also was down for BAC. It’s going to be very difficult for banks to come back when net interest margin continues to be a headwind.
MS shares were flat ahead of the bell after the bank blew past analysts’ earnings expectations with an EPS of $1.96. Analysts had expected $1.10. Revenue exceeded consensus by $3 billion on the back of strong trading results. That wasn’t unexpected after other banks like JP Morgan Chase & Co.JPM and Goldman Sachs Group, Inc. GS also reported strong Q2 trading. MS is one of the leading banks in that category.
Trading was great at MS, but at the end of the day, overall results would have been even more solid if the company had some net-interest margin to work with. It just wasn’t there with the Fed holding rates at zero.
The first FAANG to report this quarter, Netflix (NFLX), bows after the close today. With NFLX, it’s a numbers game. Some analysts worry subscription growth could be nearing its peak.
NFLX was like nectar to bees in Q1, attracting a mind-blowing 15.77 million new subscribers— more than double its 7 million projection—as quarantines kept most Americans indoors. What might NFLX do for an encore?
Let’s Have Class Outside
In the pre-Covid era, an “outside day” was a technical market term used to describe a chart pattern where a stock or commodity price went both above and below its previous day’s high and low.
Today, “outside” days arguably have a different definition, and Wednesday fit the new term well. Shares of companies that many investors believe would benefit if the economy fully reopened and people could go “outside” again did best.
There were parabolic gains among some of the cruise ship lines, where a few stocks rose 15% to 20%. Airlines, hotels, casinos—all the names that often got left out of the conversation earlier this year when people were forced to stay home—came back out to play on Wednesday.
So did small-caps. The Russell 2000 Index (RUT) just crushed it, rising 3.5% to easily outpace all other indices on a day when regional bank stocks, which make up a big part of that index, embarked on a nice rally.
Wednesday marked another day in the recent pattern where we’re seeing more cyclical and value sectors get the bulk of the buying while the formerly sizzling Tech sector stands back (see more below). While it’s way too early to say this is an established trend, it bears watching in the days ahead and is arguably a very healthy sign.
We mentioned a couple days ago that the Tech sector was looking over-extended from a valuation and chart standpoint, and that some analysts said either Tech could drop down to get more in sync with the rest of the market or it could pause for the rest of the market to catch up. The latter scenario was the more bullish one, and that’s what seems to be happening at least for now. Hopes that the economy can rebound came mainly from the positive early vaccine trial results announced late Tuesday by Moderna, Inc. MRNA.
To reiterate yesterday’s warning, these are early results and don’t guarantee anything about how the next phase of trials will go. Health Care can be a frustrating endeavor, where many products showing positive performance early on fail to impress in critical Phase 3 trials. Hopefully that won’t be the case this time, because so much is riding on it. On the other hand, even if MRNA doesn’t end up having success, it’s good to know that many other companies also have treatments and vaccines under study.
Industrials, Financials, and Energy are all having good weeks here. That’s really nice to see for anyone who was hoping this rally didn’t get too top-heavy. Information Technology is up less than 1% over the last five sessions, and most of the FAANGs either gave ground or only rose a bit on Wednesday. Could this be sector rotation? More on that below.
Strong GS earnings and the MRNA vaccine news weren’t the only things driving stocks higher at midweek. The Fed’s July Beige Book saw an increase in consumer spending across all districts, and the Empire State Manufacturing Survey for July jumped to 17.2 from -0.2 in June, research firm Briefing.com pointed out.
CHART OF THE DAY: SUPPORT IN PLACE. This three-month chart of the S&P 500 Index (SPX—candlestick) shows how it pushed above its 200-day moving average (blue line) back in May and then bounced off it a couple of times since. The SPX is now well above the 200-day, but this chart hints that it could find support if it ventures back down there, should previous patterns hold. Data Source: S&P Dow Jones Indices. Chart source: The thinkorswim® platform from TD Ameritrade. For illustrative purposes only. Past performance does not guarantee future results.
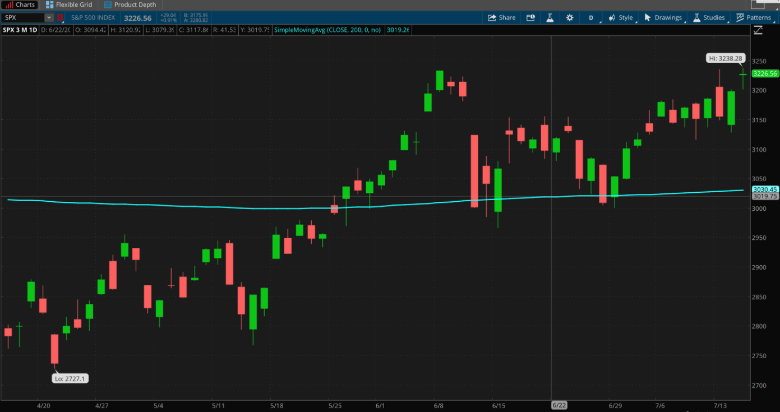
This Might Sound Technical: Looking at things from a chart’s-eye view, it’s also positive to see the S&P 500 Index (SPX) rebound from recent lows of around 3150. That was seen by some analysts as an area of psychological support, and it’s held pretty well most of this month. The SPX closed just below 3230 on Wednesday, putting it right under its post-COVID intraday high of near 3240 posted in early June.
At this point, there doesn’t seem to be a lot of enthusiasm about pushing much above that, though it would be a bullish sign if the SPX could find a way to get and stay there. Until that happens, it seems more likely that the SPX could continue to bounce between 3150 and current levels. The June 8 close of 3232 could be the level to watch. It’s been more than a month and the SPX hasn’t been able to claw back above that. Intraday moves don’t count, either. People who monitor charts like to see actual closes above resistance, and preferably for more than one or two days.
If you’re wondering about technical support, the moving averages are way below current levels, kind of like they were early this year before the pandemic. You have to go all the way down to 3030 to find the 200-day moving average, and that’s a level that’s held very well ever since the SPX forged back above it in May.
On Guard: Yesterday’s sharp early rally on GS earnings and hopes for a vaccine shouldn’t necessarily cloud investors’ views about how this reporting season has begun. There’s definitely some caution out there from the big banks that’s worth keeping in mind as other sector results start coming in. The earnings season is off to a very guarded start, We’re seeing cautious forecasts from companies that expect the economy to possibly take a step back because of worsening COVID-19 trends, or at least take longer to recover than expected. It’s a relief that they’re prepared for bad scenarios, and that might have helped give the market a little confidence. Collectively, the big banks set aside $27 billion during Q2 to cover loans potentially going bad due to the recession.
What’s going to be interesting in the days and weeks ahead is to see what kind of measures other companies take to guard against a possible second wave, and also to see if some of the companies whose stocks have moved the most from their March lows (Info Tech) can deliver results that inspire confidence in their sky-high stock prices. That said, most investors seem to have thrown out traditional valuation measures, at least for now.
What Sector Rotation Might Mean: While it’s way too early to say there’s a wholesale sector rotation underway, more hints cropped up Wednesday. Once again, Tech stepped back, and once again, the small-cap Russell 2000 (RUT) index took a big lead among the indices. Remember, of course, that when we compare the RUT to the mega-cap Tech stocks, it’s far from an apples-to-apples example. The aggregate market capitalization of all the stocks in the RUT is slightly above $2 trillion. It only takes two stocks in the S&P 500 Index (SPX)—Apple, Inc. AAPL and Microsoft Corporation MSFT—to be worth more than all 2,000 stocks in the RUT combined. So a rally in the RUT could be seen as kind of a tempest in a teapot, for lack of better words.
Also, Tech and Communication Services together make up about 40% of the SPX’s market cap, compared with around 2% for Energy and 10% for Financials, both seen by many analysts as “value” sectors and both of which rallied Wednesday. In other words, if value sectors and small-caps start to outpace large-cap growth areas like Technology, it might not be enough to keep the overall market on a rally footing, simply because the weighting is so much lower for value. We’ll have to watch and wait.
Good Trading,
JJ
@TDAJJKinahan
TD Ameritrade® commentary for educational purposes only. Member SIPC.
Edge Rankings
Price Trend
© 2025 Benzinga.com. Benzinga does not provide investment advice. All rights reserved.
Trade confidently with insights and alerts from analyst ratings, free reports and breaking news that affects the stocks you care about.

