


(Monday Market Open) Stocks rebounded early Monday as yields fell across the globe and the dollar also slipped, but a packed calendar of Fed speakers over the coming days could keep rate-related headwinds blowing on Wall Street.
No fewer than 10 Fed speakers take the podium this week. They’re widely expected to continue their hawkish rhetoric after the latest Fed rate hike helped end Q3 on a sour note. Meanwhile, a host of data hit the tape between now and the coming weekend, including key manufacturing numbers today and the September payrolls report Friday.
The SPX is down 25% over the first nine months of 2022, the worst performance for the first nine months of a year since 2002, according to The Wall Street Journal.


Potential Market Movers
Everything this week builds up to Friday’s September payrolls report. Almost all the recent U.S. labor market statistics seem diametrically opposed to what companies are saying. We’ve heard from a lot of firms with their fingers on the pulse of the global economy and none of it’s been good. There’s been a buildup in product inventories, including from Nike NKE, and Wall Street analysts are cutting price targets.
Oddly, at the same time, job growth keeps climbing. Jobless claims fell to new five-month lows last week, so tomorrow’s JOLTS report and Friday’s monthly jobs data might help clarify what’s happening behind the scenes, especially within sectors. With JOLTS tomorrow, analysts are curious to see if the openings fall below 11 million considering recent job cuts and hiring freezes across many industries.
This week also brings a look at the U.S. manufacturing industry with this morning’s September ISM Manufacturing Index. Last month’s headline ISM of 52.8% showed the sector remained in expansion mode above 50%, but not by much. It hasn’t been below 50% since 2020. However, consensus on Wall Street is for September ISM of 52%, according to Briefing.com.
From an individual stock standpoint, Apple AAPL might swing the most weight in coming days. Its steep losses Thursday and Friday appeared to set a negative tone for the market. It’s just a reminder of how much influence this $2 trillion stock has. If AAPL can get some traction and find its footing, that may spread a little cheer.
Meanwhile, the earnings picture this week takes investors on a trip to the grocery store with Conagra CAG and McCormick MKC.
On the commodities side, the Organization of Petroleum Exporting Countries (OPEC) is scheduled to meet later this week, and industry news reports predict a 500,000 to one-million barrel a day oil output cut. Still, U.S. WTI crude fell below $80 per barrel at the end of last week before jumping sharply this morning. We’ll see if that helps the Energy sector, though it’s interesting to see natural gas down 3% this morning even with crude up 5%.
From a technical standpoint, the steep losses late Friday potentially caused some real damage on the charts. The S&P 500® (SPX) had been holding above the 3,610 to 3,615 level most of that day before the bottom fell out. There’s a slight recovery early today, but the market still looks technically soft.
Reviewing the Market Minutes
Investors might be excused for wanting to forget how the market finished last week. Nevertheless, as a reminder the major indexes continued their respective declines and several set new 2022 lows on Friday.
After pivoting around the unchanged level much of the session Friday, major indexes gave up the fight in the last hour of the day to post new closing lows and again fall to their lowest levels since 2020. Worries about inflation and Fed rate hikes weighed on stocks after a surprisingly hot August Personal Consumption Expenditures (PCE) report on spending and prices.
The SPX fell 1.5% to 3,585, and the Nasdaq® (COMP) lost the same percentage to wrap up the week at 10,575. The Dow Jones Industrial Average ($DJI) did even worse, losing 1.7% to finish Friday at 28,725. The $DJI finished September down more than 8% for the month, and the SPX had its worst month since March 2020. Friday’s settlement was the lowest for the SPX since Nov. 23, 2020.
Ten of the 11 S&P sectors fell Friday, with utilities faring worst. Real estate was the only sector in the green. Utilities might be getting pressure from rising Treasury yields because income-seeking investors can now find Treasuries paying rates that compete strongly with dividends from utility stocks. The same could be true for the consumer staples sector.
Friday’s late selling was a reminder that the final hour of the day can be a dangerous one to trade in, and that the benchmark 10-year Treasury yield is being closely watched and quickly reacted to by investors. The 10-year yield soared in the final hour Friday, finishing at nearly 3.8% after falling to 3.7% earlier in the session. The late move in yields might be more evidence that pressure on fixed income isn’t going away. However, the yield slipped to start the new week.
The Cboe Volatility Index® (VIX) didn’t seem to find much traction on a run above 33 last week, finishing below 32 on Friday. VIX got a slight bump early Monday, but it would likely take a move through resistance between 35 and 37 for volatility to jolt the market again. Even so, VIX remains above 30, so the threat of volatile markets hasn’t retreated.
The U.S. Dollar Index (DXY) came off its highs late last week. That raises the question of whether it’s possible the index peaked when it climbed to nearly 115. The dollar’s direction this week is worth watching for potential impact on stocks. It recently traded around 112.
Another source of pressure Friday was some large growth companies falling to new 52-week lows. These included Alphabet GOOGL, Nike NKE, 3M MMM, AT&T T and a host of others. Seeing these notable shares scrape bottom might have caused some accelerated selling in the late hours as investors scrambled to take cover ahead of the weekend. In all, 486 companies on the New York Stock Exchange set new 52-week lows Friday, according to The Wall Street Journal.
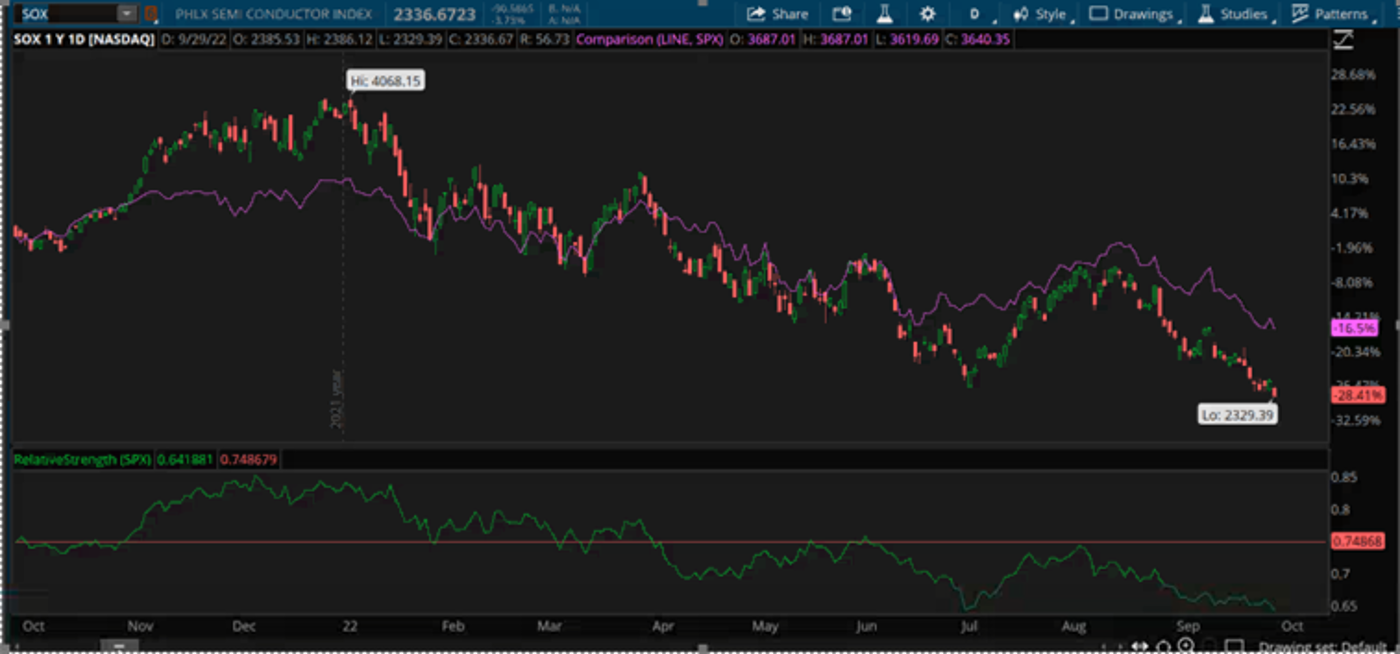
CHART OF THE DAY: CHIPS CHOPPED. Over the last year, the PHLX Semiconductor Sector (SOX-candlestick) has fallen more than the broader Nasdaq® (COMP). This could be a sign of trouble because chip company fortunes are more directly tied to consumer health than many of the other technology industry companies represented in the COMP. Consumer spending represents about 70% of U.S. gross domestic product (GDP). Data Sources: Philadelphia Stock Exchange, Nasdaq. Chart source: the thinkorswim® platform. For illustrative purposes only. Past performance does not guarantee future results.
Three Things to Watch
LOOKING FOR CLUES: Last week brought news that Apple (AAPL) may be seeing slower iPhone demand growth. Micron (MU) executives cited “a sharp and sudden” drop in demand. Nike (NKE) shares plunged after the company reported a 44% surge in inventories. Crude oil prices are down one-third from their summer highs. Amid all of these signs of an ailing global economy, it seems logical to expect the labor market and inflation to sag at least a little, but there isn’t much evidence of that. Instead, there’s a growing divergence between what the data show and what companies say. The stock market, however, may offer the answer. It tends to be a leading indicator for the economy, historically falling ahead of recessions and rising ahead of recoveries. If the stock market’s new lows are any indication, investors would be wise to believe what companies are saying and prepare for tougher economic times ahead.
AUTO RACING: Last week didn’t offer much in the way of “vroom, vroom” for investors, unless you count the initial public offering (IPO) of carmaker Porsche in Europe. Porsche debuted with a market capitalization of around $74 billion, and the stock picked up acceleration on its first day with a better than 5% gain. The company chose one of its icons to symbolize the stock symbol, which is P911. As any car fan knows, the 911 is the company’s most famous model that dates back nearly 60 years. The carmaker, which is majority-owned by Volkswagen, has 911 million common and preferred shares. The IPO by Porsche came in what’s been a very slow year for IPOs across Europe. There’ve been only 231 so far this year, vs. 873 during last year’s surge, according to data from Pitchbook. The Porsche shares aren’t traded in the U.S., but another famous European car company does have shares here. Ferrari shares go by the symbol, “RACE” on the New York Stock Exchange (NYSE). Maybe that’s because they couldn’t fit “Testarossa” into four or fewer letters.
SLAMMING THE IPO BRAKES: The sluggish European IPO market met its match this year. As of mid-September, U.S. 2022 IPOs were down 80% vs. the same period in 2021, according to Nasdaq. Even more stunning: Companies that went IPO this year raised just 5% of the proceeds of companies that went IPO in the same period last year, putting 2022 on pace to be the slowest IPO year in about three decades. For perspective, 2021 was the busiest IPO year ever in terms of the number of IPOs and the proceeds raised, Nasdaq said. But it called the 2021 surge “nothing less than a bubble” due to “extraordinary liquidity” sloshing around after the Fed’s 2020 monetary easing.
Companies that missed last year’s party are having to either cancel their IPOs or accept much lower valuations. And many investors who bought IPOs last year wish they hadn’t. Those who bought into the 10 biggest IPOs of 2021 lost 43% of their money through Sept. 17, when the Nasdaq report came out. Is the IPO market headed for a rebound? Not necessarily. The near future for IPOs is “much bleaker,” Nasdaq said. “The ‘growth at all costs’ era is over,” Nasdaq added. “It’s now ‘safety time.’ “
Notable Calendar Items
Oct. 4: August JOLTS job openings, August Factory Orders, and earnings from Acuity Brands (AYI)
Oct. 5: September ADP Nonfarm Employment, September ISM Non-Manufacturing Index, and Trade Balance
Oct. 6: Earnings from Conagra (CAG) and McCormick (MKC)
Oct. 7: Nonfarm Payrolls, Wholesale Inventories, and earnings from Tilray (TLRY)
Oct. 11: Earnings from PepsiCo (PEP)
Oct. 12: September Producer Price Index
Oct. 13: September Consumer Price Index, earnings from Delta (DAL), Domino’s (DPZ), Walgreen’s Boots Alliance (WBA)
TD Ameritrade® commentary for educational purposes only. Member SIPC.
Image sourced from Shutterstock
This post contains sponsored advertising content. This content is for informational purposes only and not intended to be investing advice.
Edge Rankings
Price Trend
© 2025 Benzinga.com. Benzinga does not provide investment advice. All rights reserved.
Trade confidently with insights and alerts from analyst ratings, free reports and breaking news that affects the stocks you care about.

