


An analysis by JPMorgan Chase & Co.’s quantitative strategists, led by Khuram Chaudhry, has drawn striking parallels between the current U.S. equity market’s structure and the notorious dot-com bubble of the early 2000s.
The team’s recent findings indicate a concerning concentration of market power in the hands of the top 10 stocks on the MSCI USA Index, reminiscent of the worrisome market conditions seen two decades ago.
As Bloomberg reported Tuesday, the combined share of the MSCI USA Index’s top 10 stocks, including the prominent ‘Magnificent Seven’ technology giants, has escalated to a significant 29.3% in December. This figure approaches the historical peak of 33.2% witnessed in June 2000, during the height of the dot-com bubble.
Diversity within these top ranks is also dwindling, with only four sectors represented, a stark contrast to the historical median of six. This lack of diversification heightens the vulnerability of the market to shocks in these sectors.
10 Stocks Account For Make Nearly A Third Of The S&P 500 Index
When we take a closer look at the SPDR S&P 500 ETF Trust (NYSE:SPY), the top 10 holdings currently comprise 31.8% of the entire index, and interestingly, just three sectors – information technology, communication services, and consumer discretionary – together make up a substantial 50% of the S&P 500 index.
| Top 10 S&P 500 Holdings | Sector | Weight |
|---|---|---|
| Microsoft Corporation (NYSE:MSFT) | Information Technology | 7.31% |
| Apple Inc. (NASDAQ:AAPL) | Information Technology | 6.85% |
| NVIDIA Corporation (NASDAQ:NVDA) | Information Technology | 3.67% |
| Amazon.com, Inc. (NASDAQ:AMZN) | Consumer Discretionary | 3.52% |
| Alphabet Inc. (NASDAQ:GOOGL) | Communication Services | 2.19% |
| Meta Platforms, Inc. (NASDAQ:META) | Communication Services | 2.13% |
| Alphabet Inc. (NASDAQ:GOOG) | Communication Services | 1.86% |
| Berkshire Hathaway Inc. (NYSE:BRK) | Financials | 1.71% |
| Broadcom Inc. (NASDAQ:AVGO) | Information Technology | 1.29% |
| Eli Lilly and Company (NYSE:LLY) | Health Care | 1.24% |
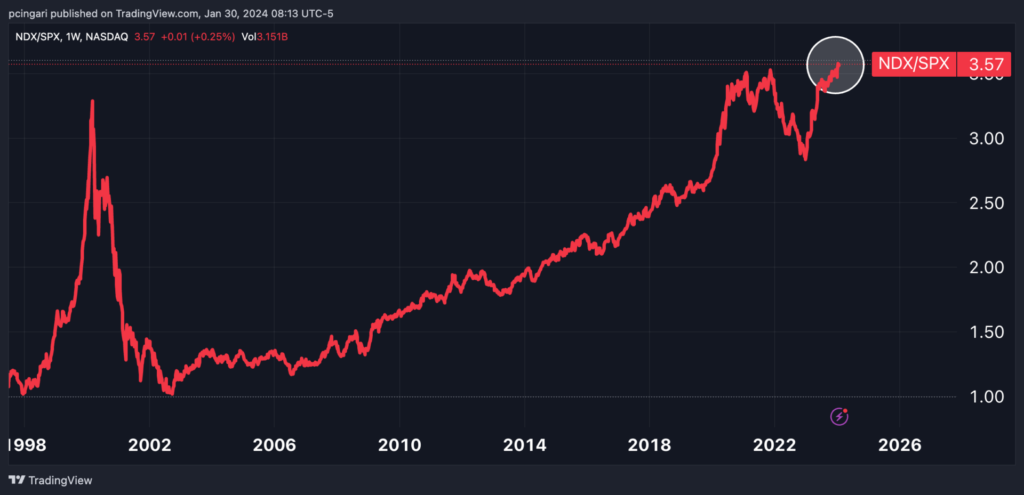
The unchallenged dominance of tech giants is also expressed by the ratio between the Nasdaq 100 and the S&P 500, which is currently at an all-time high, surpassing the previous peaks of late 2021 and February 2000.
Chart: Nasdaq-To-S&P-500 Ratio

Comparing Past And Present Market Concentrations
Despite often dismissed parallels with the 2000 internet stock frenzy, JPMorgan’s analysis underscores striking similarities.
Data shows the current situation is “far more similar than one may think,” they said.
According to the team, extremely concentrated markets present a clear and present risk to equity markets in 2024. They caution that any downturn among these top 10 stocks could trigger a broader market slump.
This warning comes amid a backdrop of a resilient U.S. economy and speculative fervor around AI advancements, factors that have propelled a rally in tech stocks like Nvidia Corp. and Microsoft Corp. However, this optimism may be teetering on the edge of a bubble.
Chaudhry’s team notes, however, that overall valuations today are less extreme than those seen in the early 2000s. Despite this, they warn of the risks associated with such concentrated valuations, potentially signalling a nearing threshold that could necessitate a market correction.
Photo: Shutterstock
© 2025 Benzinga.com. Benzinga does not provide investment advice. All rights reserved.