


AMC Entertainment Holdings, Inc AMC closed Tuesday’s trading session down over 8%, after bouncing up about 4% on Monday, which Benzinga called out on Friday as a likely scenario. On Wednesday, the stock was trading up over 4% higher at one point, in tandem with the S&P 500, which was rebounding over 1%.
On April 22, AMC announced the launch of Laser at AMC, its first major projector upgrade since transitioning to digital. The equipment, worth an estimated $250 million, will be installed in 3,500 cinemas by the end of 2026.
Laser at AMC will not only enhance the viewing experience, with more vivid color and better contrast, but the technology has less of an environmental impact, which is the “greenest environmental initiative in AMC’s 102 year history,” said to CEO Adam Aron.
Want direct analysis? Find me in the BZ Pro lounge! Click here for a free trial.
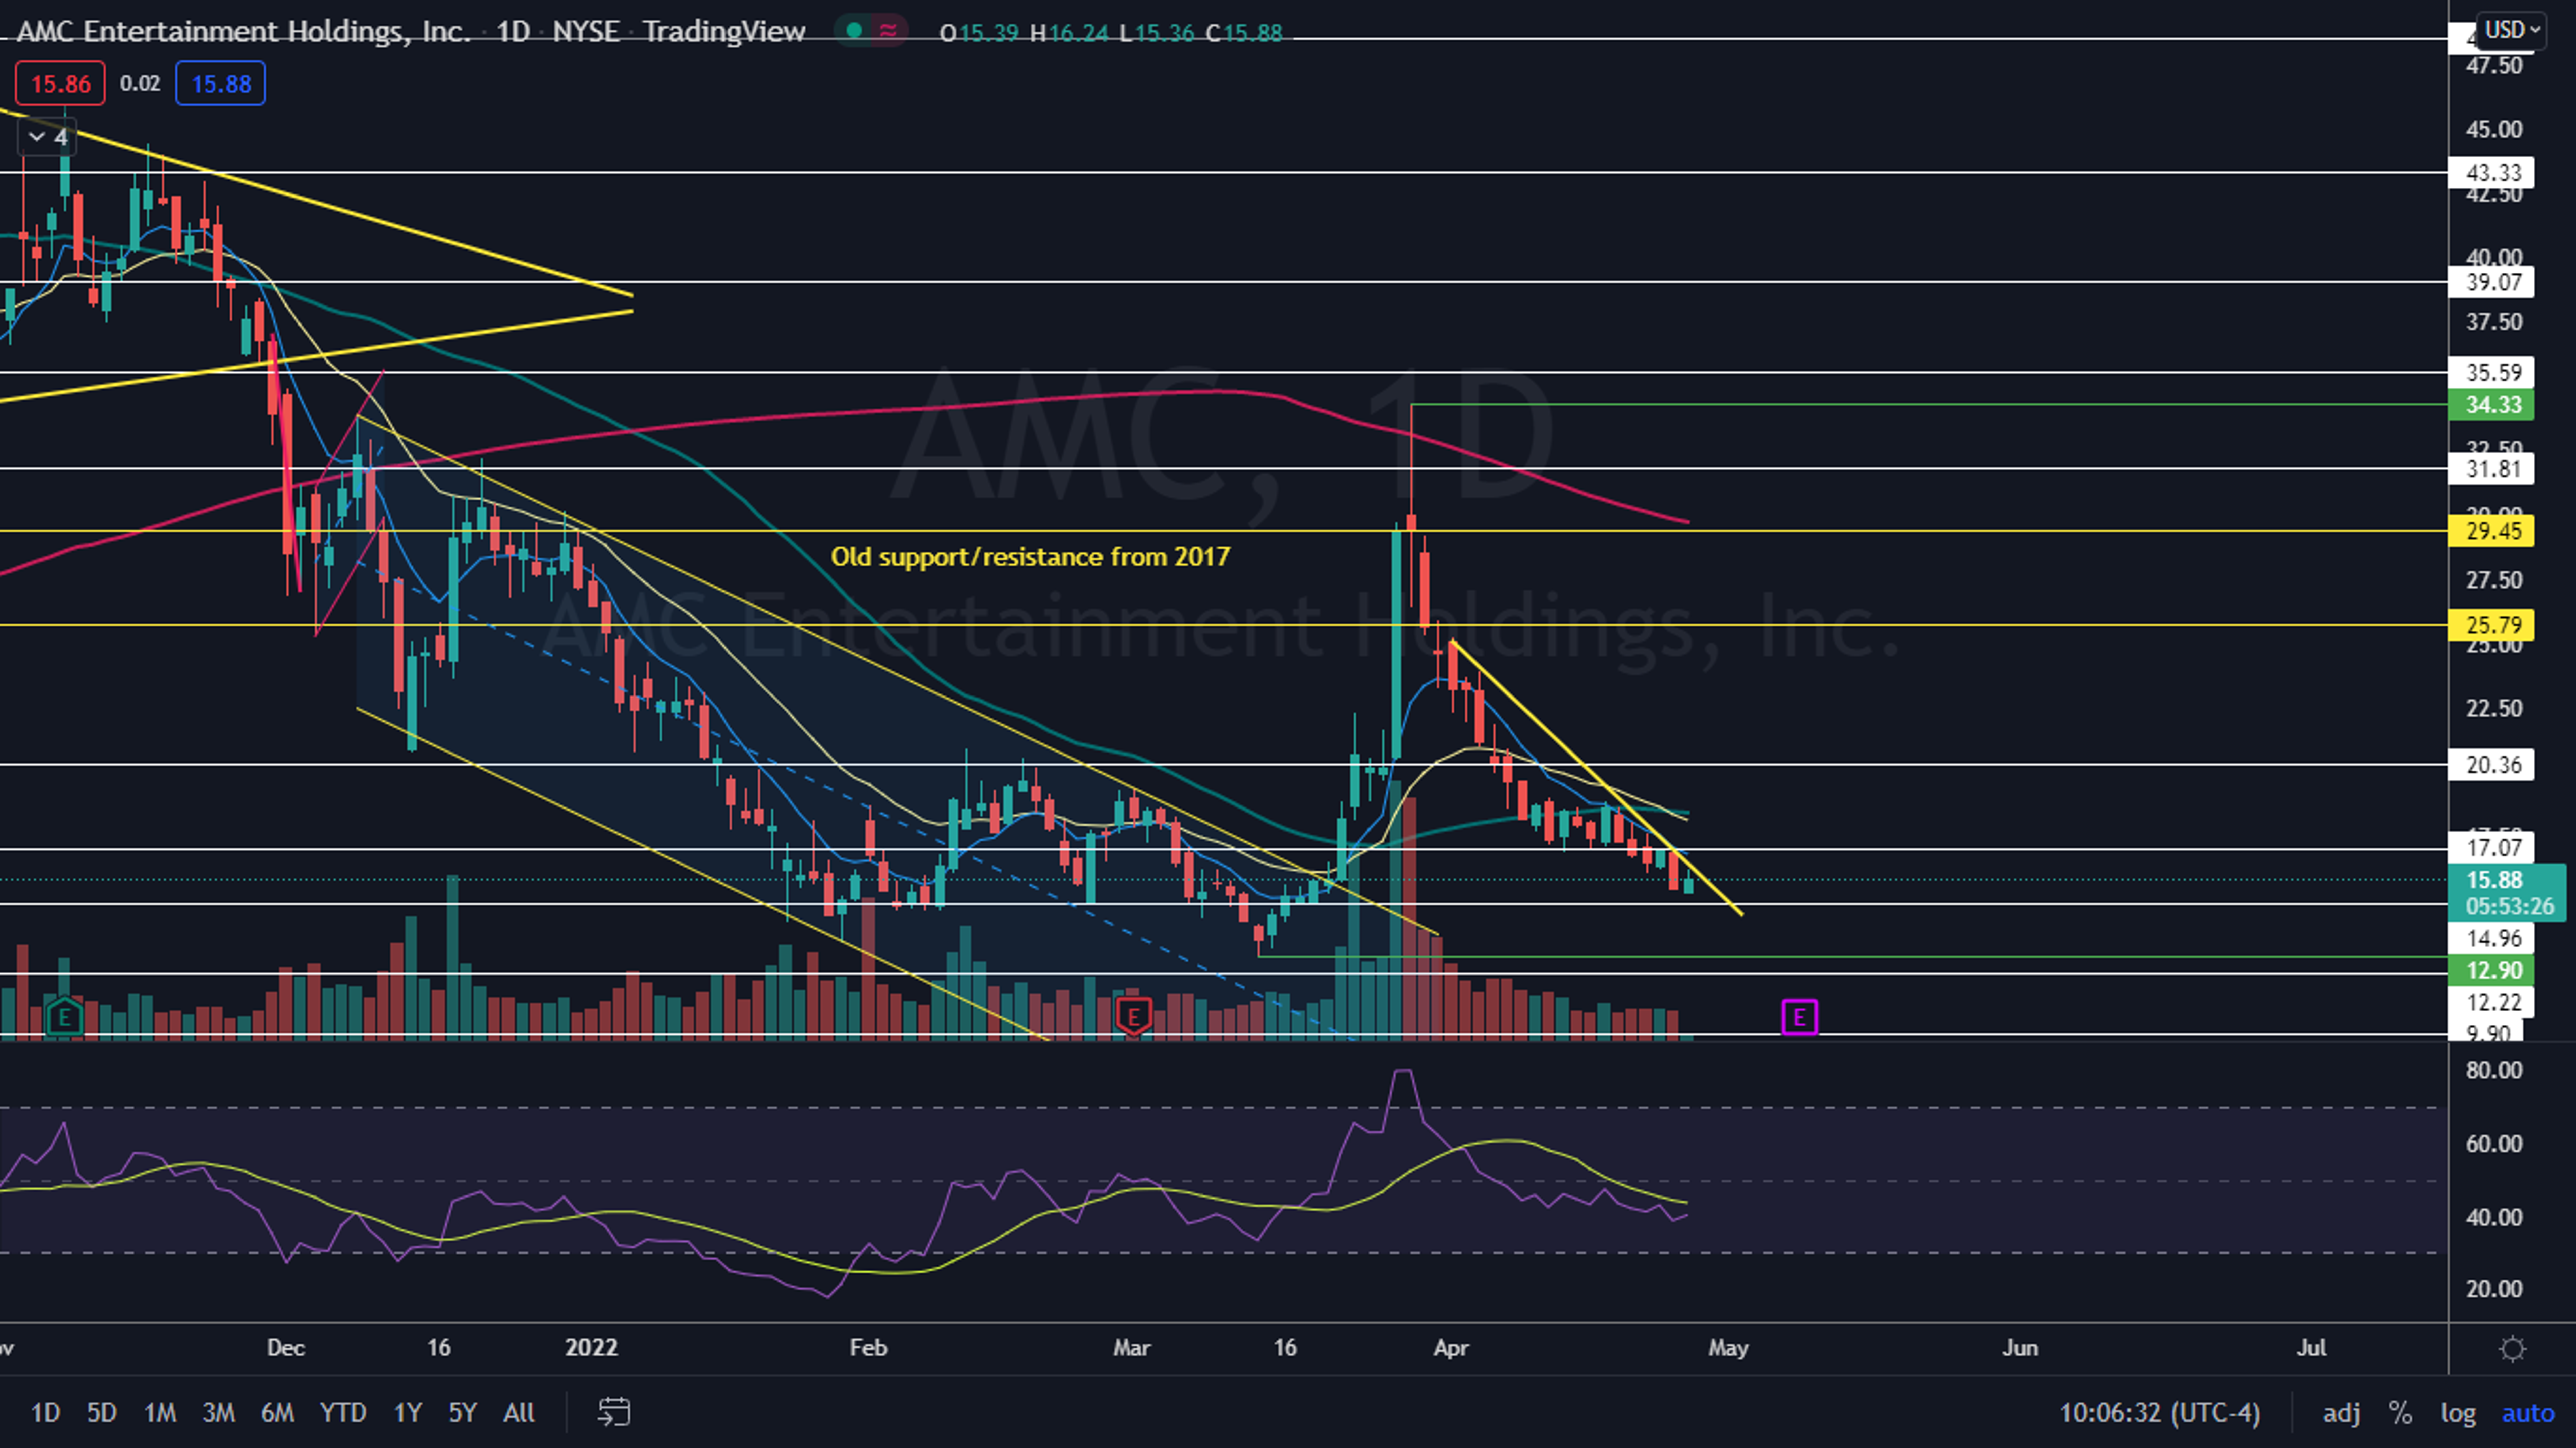
The AMC Chart: AMC has been trading in a heavy downtrend, after soaring 160% between March 15 and March 29 to reach a high of $34.33. The most recent lower high was printed on March 19 at $18.92 and the most recent confirmed lower low was created at the $16.97 level on April 13 and April 18.
- AMC has begun to develop a descending trendline pattern on the daily chart, which has been holding the stock down since April 1. When a stock breaks up from a descending trendline, it can be a powerful reversal signal. Bullish traders can watch to see if a break up from the level takes place on higher-than-average volume to indicate if the pattern has been recognized.
- If AMC is able to break up from the trendline, it will regain the eight-day exponential moving average as support, which would give bulls more confidence going forward. The stock is currently trading under the eight-day EMA, as well as the 21-day EMA, which is bearish.
- If AMC continues to trade lower under the trendline, the stock’s relative strength index (RSI) will eventually drop to the 30% level, which is where a larger bounce may come. When a stock’s RSI nears or reaches that level, it becomes oversold, which can be a buy signal for technical traders.
- AMC has resistance above at $17.07 and $20.36 and support below at $14.96 and $12.22.

See Also: How to Read Candlestick Charts for Beginners
Photo: Created with an image from Dave Dugdale on Flickr
© 2024 Benzinga.com. Benzinga does not provide investment advice. All rights reserved.
Trade confidently with insights and alerts from analyst ratings, free reports and breaking news that affects the stocks you care about.

