
Advanced Micro Devices AMD was plunging 8% on Thursday, negating the uptrend the stock began trading in on March 8 when it bounced off the $100 level.
The uptrend may not be the dominant pattern, however, and the downturn on Thursday could serve as a backtest and confirmation of a bullish break from a descending trendline.
When a stock is trading under a descending trendline, it acts as a resistance level and indicates there are more sellers than buyers as the price continues to fall. When a stock breaks up from a descending trendline, the area often acts as support.
In order for a trendline to be considered valid, the stock must touch the line on at least three occasions. After that, the more times the trendline is touched the weaker it becomes.
- Bullish traders can watch for a stock to break up from the descending trendline and, if the break happens on high volume, can indicate the downtrend is over and a rally may be on the horizon. It's possible the stock may fall down to back-test the descending trendline as support before heading higher again.
- For bearish traders “the trend is your friend” (until it’s not) and a touch and rejection of the descending trendline can offer a good short entry. A bearish trader would stop out of this type of trade if the stock broke above the trendline.
See Also: Here's Why AMD Shares Are Getting Crushed
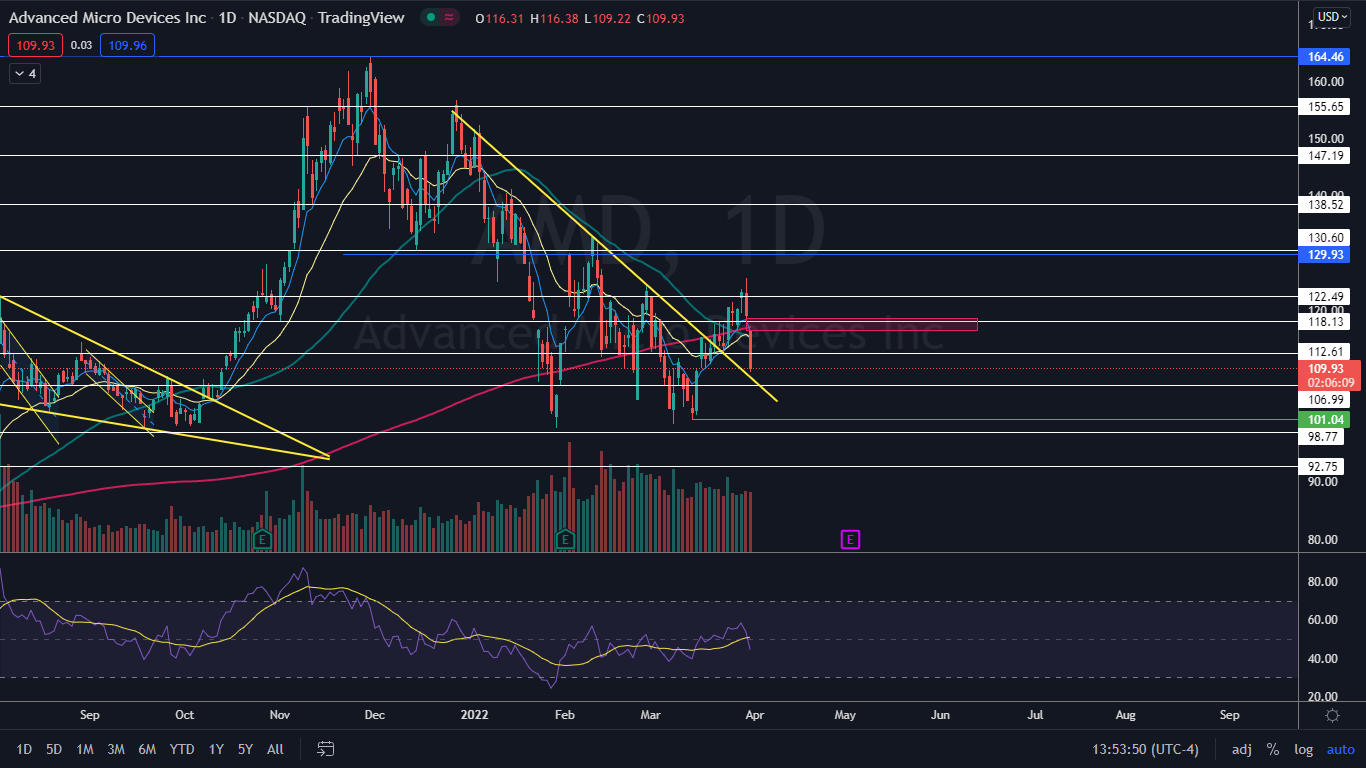
The AMD Chart: AMD gapped down to start the trading day on Thursday and continued to slide intraday. The stock has now come close to testing the descending trendline, which is currently near the $109 level as support. If AMD bounces up from the trendline, it will further confirm that algorithms have recognized the pattern and a larger move to the upside could come.
- Traders and investors who are looking to enter into a position can watch for AMD to wick up from the trendline on Thursday and form a bullish hammer candlestick, which could indicate higher prices will come on Friday.
- If the stock closes the trading day near its low-of-day, it will print a bearish kicker candlestick pattern, which could indicate lower prices are on the horizon. Traders can then watch for AMD to test the descending trendline again on Friday and form a doji candlestick above the level, which could indicate higher prices will come on Monday.
- If AMD falls through the descending trendline, the break of the pattern will be negated and traders who are in a position could place their stop at the level.
- There is a gap above on AMD’s chart between $116.31 and $118.59. Gaps on charts fill about 90% of the time, which makes it likely AMD will rise up to fill the empty trading range in the future.
- AMD has resistance above at $112.61 and $118.13 and support below at $106.99 and the psychologically important $100 level.
Want direct analysis? Find me in the BZ Pro lounge! Click here for a free trial.
© 2024 Benzinga.com. Benzinga does not provide investment advice. All rights reserved.
Comments
Trade confidently with insights and alerts from analyst ratings, free reports and breaking news that affects the stocks you care about.

