PayPal Holdings, Inc PYPL was trading down about 3% on Friday as the stock continued to trade sideways after shooting up about 26% between March 14 and March 18.
The rise paired with the sideways consolidation has settled PayPal into a bullish flag pattern on the daily chart. The bull flag pattern is created with a sharp rise higher forming the pole, which is then followed by a consolidation pattern that brings the stock lower between a channel with parallel lines.
- For bearish traders, the "trend is your friend" (until it's not) and the stock may continue downwards within the following channel for a short period of time. Aggressive traders may decide to short the stock at the upper trendline and exit the trade at the lower trendline.
- Bullish traders will want to watch for a break up from the upper descending trendline of the flag formation, on high volume, for an entry. When a stock breaks up from a bull flag pattern, the measured move higher is equal to the length of the pole and should be added to the lowest price within the flag.
A bull flag is negated when a stock closes a trading day below the lower trendline of the flag pattern or if the flag falls more than 50% down the length of the pole.
See Also: Robinhood Fires Up Rivalry With PayPal and Other Fintech With Latest Launch
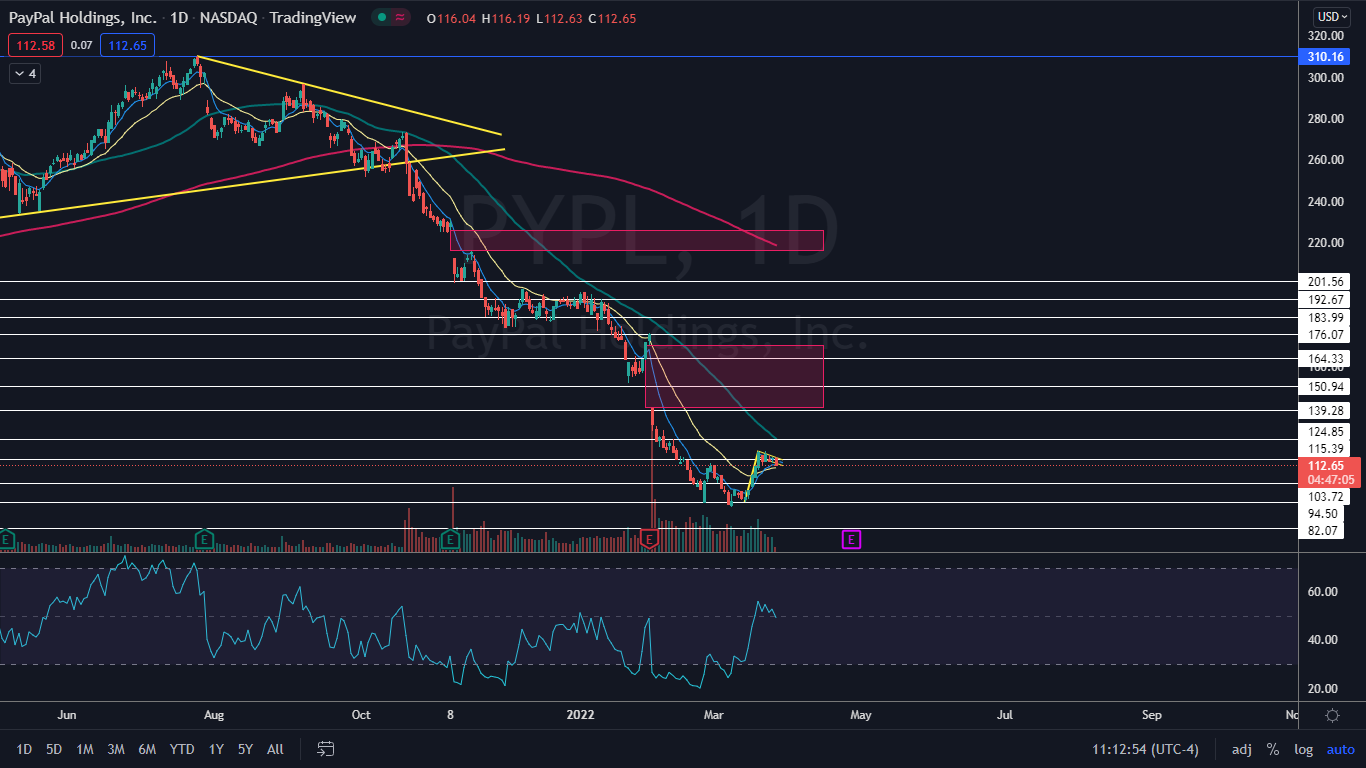
The PayPal Chart: PayPal reversed to the upside on March 15 after printing a triple bottom pattern at the $94.50 level on March 7, March 8 and March 14. The stock then soared up before beginning to trade sideways, which created a bull flag pattern on the daily chart.
- If the pattern is recognized and PayPal breaks up from the flag formation on higher-than-average volume, the measured move could take the stock up toward the $144 mark. Bullish traders may choose to take a position on the upwards break of the flag.
- Bearish traders can watch for PayPal to break down below the eight-day exponential moving average on higher-than-average bearish volume.
- PayPal has two gaps above on its chart that are about 90% likely to fill in the future. The first gap is between $139.90 and $170.53 and the second gap falls between the $215.97 and $226.25 range.
- On Friday, PayPal was trading on lower-than-average volume, which indicates there are not many buyers or sellers. By late afternoon, only about 2.94 million shares had exchanged hands compared to the 10-day average of 19.74 million.
- PayPal has resistance above at $115.39 and $124.85 and support below at $103.72 and $94.50.
Want direct analysis? Find me in the BZ Pro lounge! Click here for a free trial.
© 2024 Benzinga.com. Benzinga does not provide investment advice. All rights reserved.
Comments
Trade confidently with insights and alerts from analyst ratings, free reports and breaking news that affects the stocks you care about.

