
Snap, Inc SNAP was trading mostly flat on Wednesday in line with the SPDR S&P 500 SPY which was also showing very little movement.
On Tuesday, Cathie Wood’s asset management firm Ark Investment Management more than halved its position in the stock, dumping 798,760 shares of SnapChat’s parent group.
Short interest, although not astoundingly high, has been increasing on Snap’s stock. Of the company’s 1.22 billion share float, 48.84 million shares are held short, compared to 45.66 million in November. The current percentage of the float held short comes in at 4.05%.
Analysts have also turned more bearish on Snap recently and on Tuesday Zack’s Investment Research lowered its rating from Hold to Sell ahead of the company’s fourth-quarter earnings report set to print on Feb. 3 after the market closes.
The stock has been trading in a steep downtrend within a falling channel since gapping down over 26% following its third-quarter earnings print on Oct. 21, losing an additional 21% since that date. If Snap can buck the trend, however, the stock could be in for a major reversal.
It should be noted, however, that a stock can always go lower and technical traders should watch for signals on the chart to indicate when the bottom may be in.
See Also: Ethereum Looks Set For An Imminent Bounce, But This Pattern Suggests More Downside Ahead
The Snap Chart: On Monday, Snap bounced from the bottom descending trendline of the falling channel and printed a hammer candlestick. This indicated a move to the upside was in the cards. The stock then reacted to the signal on Tuesday and closed the trading day up 3.84% off Monday’s closing price.
On Wednesday, Snap was consolidating the move higher on lower-than-average volume, with only 7.41 million shares having exchanged hands by early afternoon compared to the 10-day average of 15.26 million shares.
If Snap closes the trading day within the $43.50 to $44.20 range, it will print a hanging man candlestick, which could indicate lower prices may come on Thursday. A hanging man candlestick is found at the top of a trend and can indicate a reversal to the downside.
Snap has two gaps on its chart, with the lower gap falling between the $28.95 and $34.52 range and the upper gap between $60.78 and $73.89. Gaps on charts fill about 90% of the time, and because Snap is trading closer to the lower gap, it's more likely to be filled first.
- Bullish traders not already in a position may choose to wait for the gap to fill before entering, or they may choose to take a position if Snap breaks up bullishly from the falling channel on higher-than-average volume.
- Bearish traders may decide to take a position the next time Snap hits the upper descending trendline of the pattern if the stock is unable to break up through it.
Snap has resistance above at $47.92 and $50.96 and support below at $43.26 and $39.96.
The stock was trading at 43.13 on Wednesday afternoon, down 0.42%.
Want direct analysis? Find me in the BZ Pro lounge! Click here for a free trial.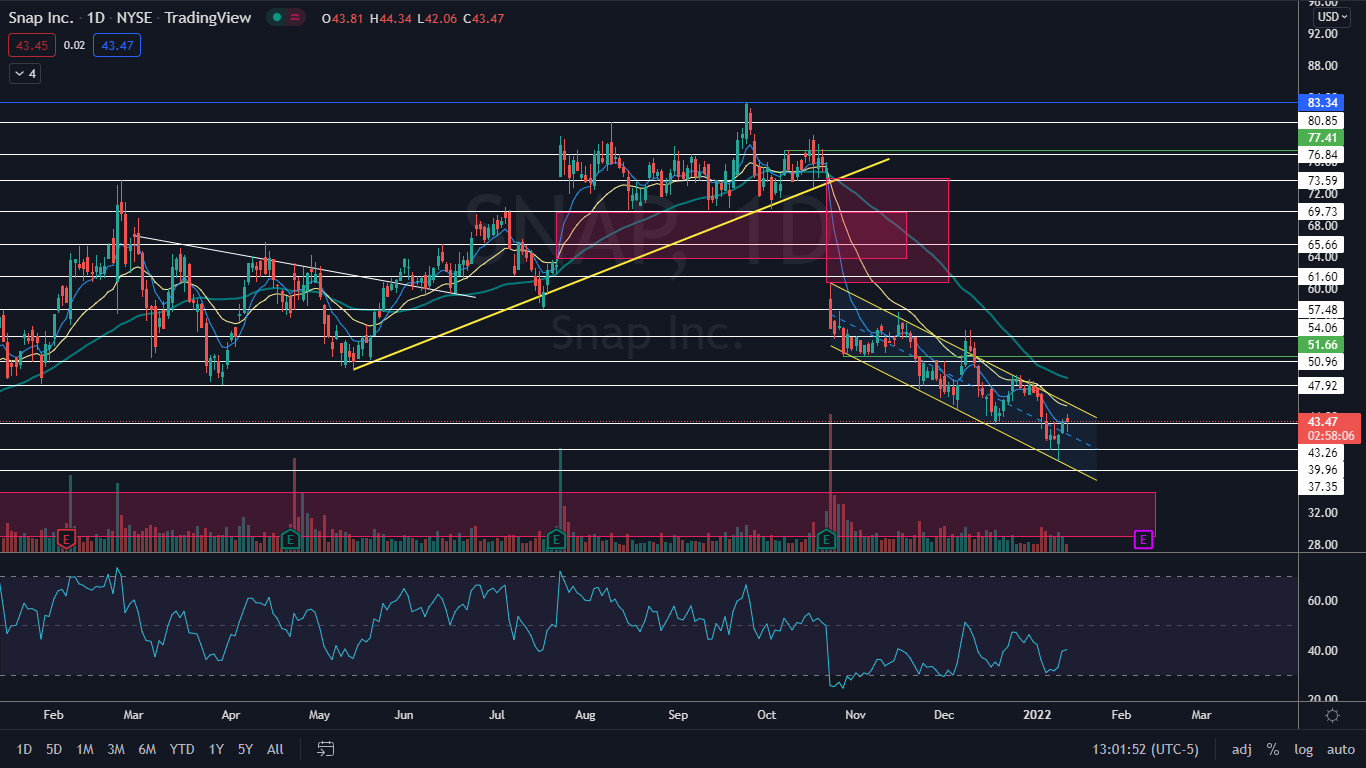
Now Read: 10 Most-Downloaded Apps Of 2021: Snapchat, Zoom, Facebook And More
© 2024 Benzinga.com. Benzinga does not provide investment advice. All rights reserved.
Comments
Trade confidently with insights and alerts from analyst ratings, free reports and breaking news that affects the stocks you care about.

