


Zinger Key Points
- NUGT is a double-leveraged fund that is designed to outperform the NYSE Arca Gold Miners Index by 200%.
- The ETF negated its uptrend but hasn't yet confirmed a downtrend by printing a lower high.
- 3 Summer "Power Patterns" Are About to Trigger (One With 90% Win Rate) - Get The Details Now
Spot gold was popping up above 0.5% at one point on Tuesday, propelled by escalating tensions in the Middle East following Tehran’s decision to deploy hundreds of drones and missiles toward Israel on Saturday night.
Iran’s move sparked heightened concerns that a widespread regional could break out, which would have broad negative implications for the global economy.
Gold’s break higher on Tuesday, which saw the commodity working back toward the April 12 all-time high of $2,431.78, was pulling the gold mining sector north.
Trending: Delta Flight Returns To Atlanta After Takeoff: Boeing 757 'Yawing Aggressively'
Direxion Daily Gold Miners Index Bull 2X Shares NUGT, which often follows spot gold, was reversing upward from Tuesday’s $35.84 low-of-day.
NUGT is a double-leveraged fund that is designed to outperform the NYSE Arca Gold Miners Index by 200%. The ETF tracks several gold and silver mining companies, with Newmont Corp NEM, Barrick Gold Corp GOLD and Franco-Nevada Corp FNV making up 30.05% of its holdings.
It should be noted that leveraged ETFs are meant to be used as a trading vehicle by experienced traders, as opposed to a long-term investment. Leveraged ETFs should never be used by an investor with a buy-and-hold strategy or those who have low-risk appetites.
For traders wanting to play the gold mining index bearishly, Direxion offers Direxion Daily Gold Miners Index Bear 2X Shares DUST.
Want direct analysis? Find me in the BZ Pro lounge! Click here for a free trial.
The NUGT Chart: NUGT rallied about 88% between Feb. 28 and April 12, where the ETF reached an 11-month high of $43.58. On Friday, the ETF retraced on higher-than-average volume and on Monday and Tuesday, the ETF was looked to consolidate on decreasing volume.
- On Tuesday, NUGT negated its uptrend by printing a lower low under the most recent higher low, which was formed on April 10 at $37.15. Although the uptrend was negated, a downtrend won’t be confirmed unless the ETF prints a lower high under the 11-month high.
- Also on Tuesday, NUGT was worked to print a dragonfly doji or hammer candlestick, which could indicate the local bottom has occurred and the ETF will rise higher again on Wednesday. If that happens, bulls want to see the ETF regain the eight-day exponential moving average (EMA) as support.
- Bearish traders want to see NUGT reject the eight-day EMA and then for big bearish volume to come in and knock the ETF down under Tuesday’s low-of-day, which would confirm a new downtrend.
- NUGT has resistance above at $37.68 and at $41.31 and support below at $33 and at $28.13.

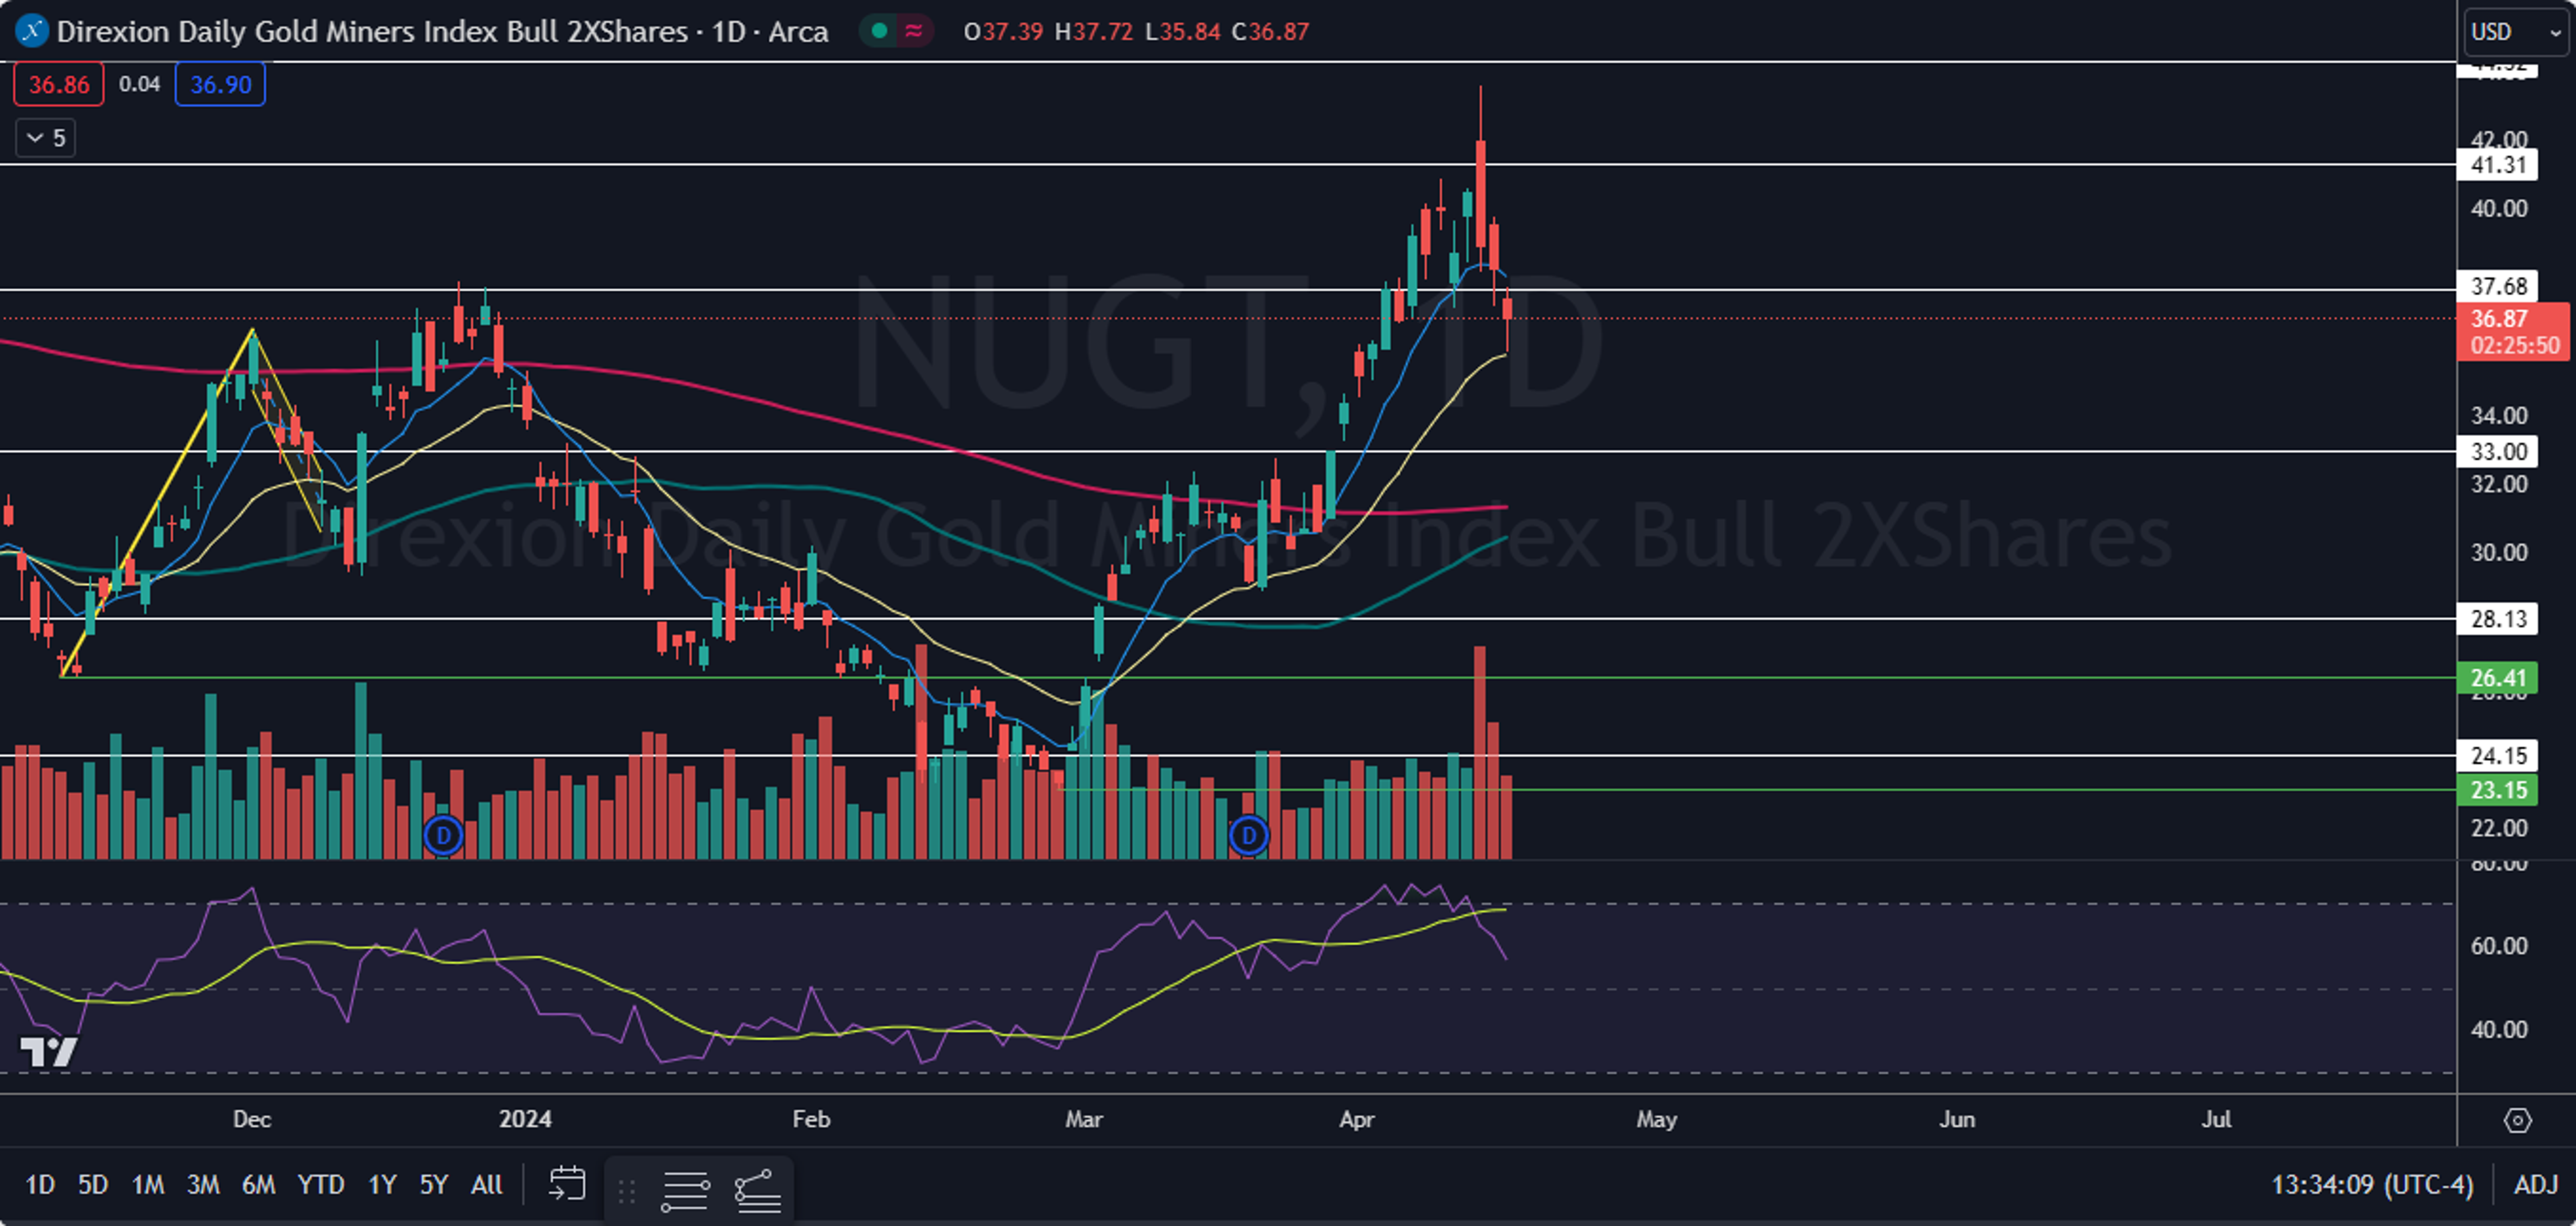
Image sourced from Shutterstock
Edge Rankings
Price Trend
© 2025 Benzinga.com. Benzinga does not provide investment advice. All rights reserved.
Trade confidently with insights and alerts from analyst ratings, free reports and breaking news that affects the stocks you care about.

