


The Cathie Wood-led Ark Innovation ETF ARKK was popping up almost 0.75% higher on Tuesday, confirming its uptrend remains intact after the CEO and CIO of ARK Invest defended her $2,000 Tesla, Inc TSLA price target during an exclusive interview with Benzinga.
Wood’s Innovation ETF holds a large position of Tesla shares and the EV giant was surging up almost 5% to start the post-Labor Day week.
Looking For A Leveraged Option To Play ARKK To The Upside? Traders and investors looking for leveraged long exposure to ARKK can play the AXS 2x Innovation ETF TARK.
TARK is an actively managed 2X leveraged ETF aiming to return 200% of the daily performance of ARKK. This leverage boosts trade performance, which can offer significant gains for traders.
Through trading TARK, investors benefit from upswings in ARKK, which holds stocks in industries such as electric vehicles, next-gen Internet, genomics and fintech. ARKK’s largest holdings are Tesla, weighted at 10.75%, Roku, Inc ROKU, weighted at 8.35% and Zoom Video Communications-A, which makes up 7.65% of the fund’s holdings.
It should be noted that leveraged funds are designed for short-term traders and shouldn’t be held for a long period of time.
Want direct analysis? Find me in the BZ Pro lounge! Click here for a free trial.
The TARK Chart: TARK opened lower on Monday but buyers came in and bought the dip. The dip at the market open caused a higher low to form, which indicates the ETF’s uptrend remains intact.
- TARK’s uptrend has been taking place within a rising channel pattern, where the ETF has been making a series of higher highs and higher lows. The most recent spike higher, between Aug. 25 and Friday, combined with the recent consolidation lower may have caused the ETF to form a bull flag within the channel.
- If the bull flag is recognized, and TARK eventually breaks up from the flag and channel pattern on higher-than-average volume, the measured move is about 20%, which indicates TARK could eventually rise toward the $80 mark.
- If Tark breaks down under the eight-day exponential moving average the bull flag will be negated and the ETF could fall back toward the lower ascending trend line of the channel. A breakdown from the channel could indicate the bull cycle has ended.
- TARK has resistance above at $77.20 and at $86.10 and support below at $65.46 and at $56.50.

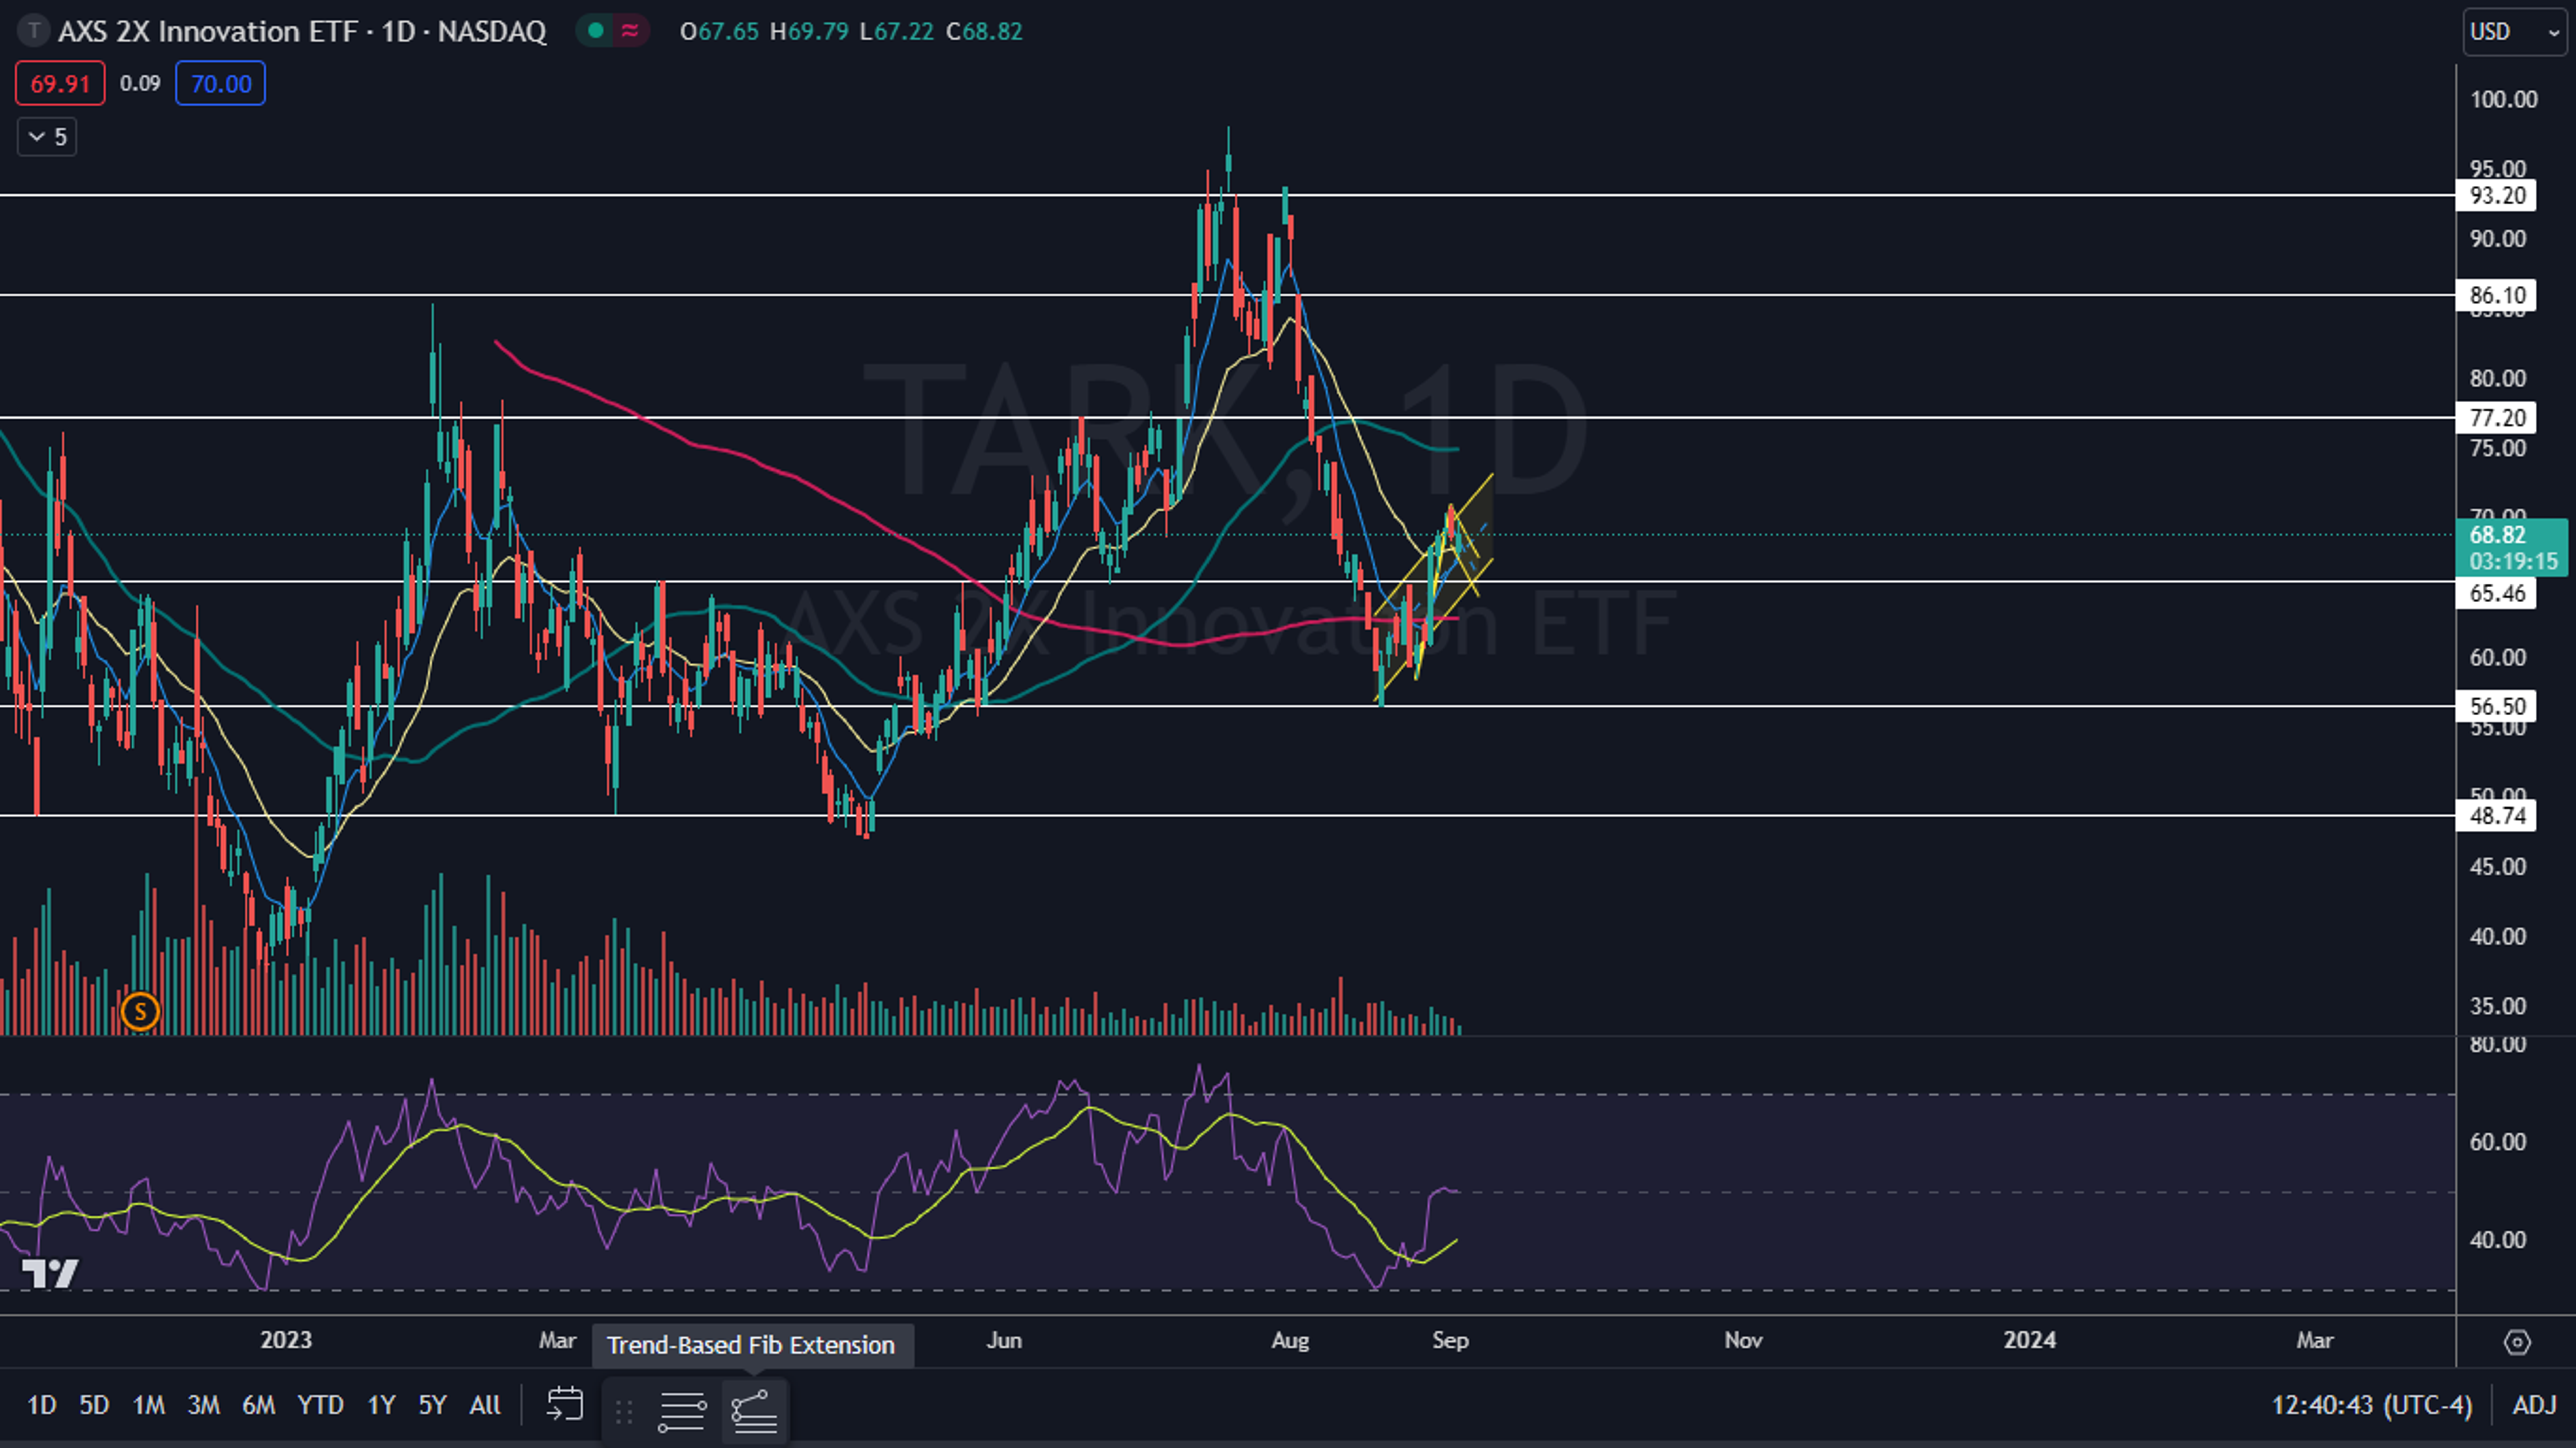
Image sourced from Shutterstock
© 2024 Benzinga.com. Benzinga does not provide investment advice. All rights reserved.
Trade confidently with insights and alerts from analyst ratings, free reports and breaking news that affects the stocks you care about.

