
American Airlines Group, Inc AAL was sliding over 8% lower on Thursday after printing its second-quarter financial results, which dragged Delta Airlines, Inc DAL lower in sympathy.
American Airlines reported earnings per share of 76 cents, which missed the estimate of 77 cents, and revenues of $13.42 billion, beating the estimate of $13.41 billion.
The bearish reaction to American Airline’s earnings print caused the stock to negate an uptrend, while the pullback in Delta’s stock confirms its uptrend is still intact.
An uptrend occurs when a stock consistently makes a series of higher highs and higher lows on the chart.
The higher highs indicate the bulls are in control while the intermittent higher lows indicate consolidation periods.
Traders can use moving averages to help identify an uptrend, with rising lower time frame moving averages (such as the eight-day or 21-day exponential moving averages) indicating the stock is in a steep shorter-term uptrend.
Rising longer-term moving averages (such as the 200-day simple moving average) indicate a long-term uptrend.
A stock often signals when the higher high is in by printing a reversal candlestick such as a doji, bearish engulfing or hanging man candlestick. Likewise, the higher low could be signaled when a doji, morning star or hammer candlestick is printed. The higher highs and higher lows often take place at resistance and support levels.
In an uptrend, the "trend is your friend" until it’s not, and in an uptrend there are ways for both bullish and bearish traders to participate in the stock:
- Bullish traders who are already holding a position in a stock can feel confident the uptrend will continue unless the stock makes a lower low. Traders looking to take a position in a stock trading in an uptrend can usually find the safest entry on the higher low.
- Bearish traders can enter the trade on the higher high and exit on the pullback. These traders can also enter when the uptrend breaks and the stock makes a lower low, indicating a reversal into a downtrend may be in the cards.
Want direct analysis? Find me in the BZ Pro lounge! Click here for a free trial.
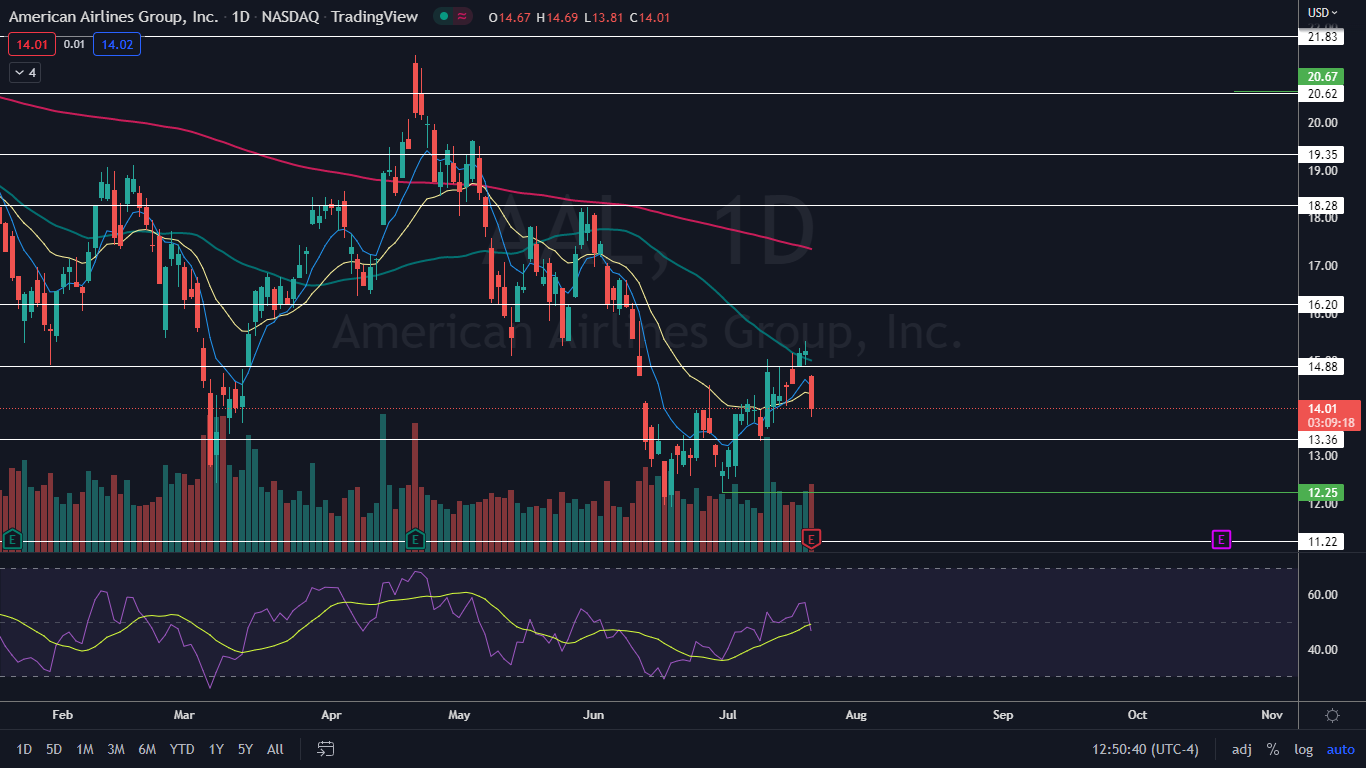
The American Airlines Chart: American Airlines negated its uptrend on Thursday when it fell under the most recent higher flow of $14.05, which was printed on July 15. If a new downtrend is on the horizon, it will need to be confirmed by a lower high printing over the coming days.
- The move lower came on higher-than-average volume, which indicates fear selling has taken place, which favors the bears. At the time of writing, over 42 million American Airlines shares had exchanged hands compared to the 10-day average of 37.8 million.
- If American Airlines closes the trading day near its low-of-day price, the stock will print a bearish kicker candlestick, which could indicate lower prices will come again on Friday. If the stock is able to close the trading day with a long lower wick, American Airlines will print a hammer candlestick, which could indicate a bounce to the upside is in the cards.
- American Airlines has resistance above at $14.88 and $16.20 and support below at $13.36 and $11.22.
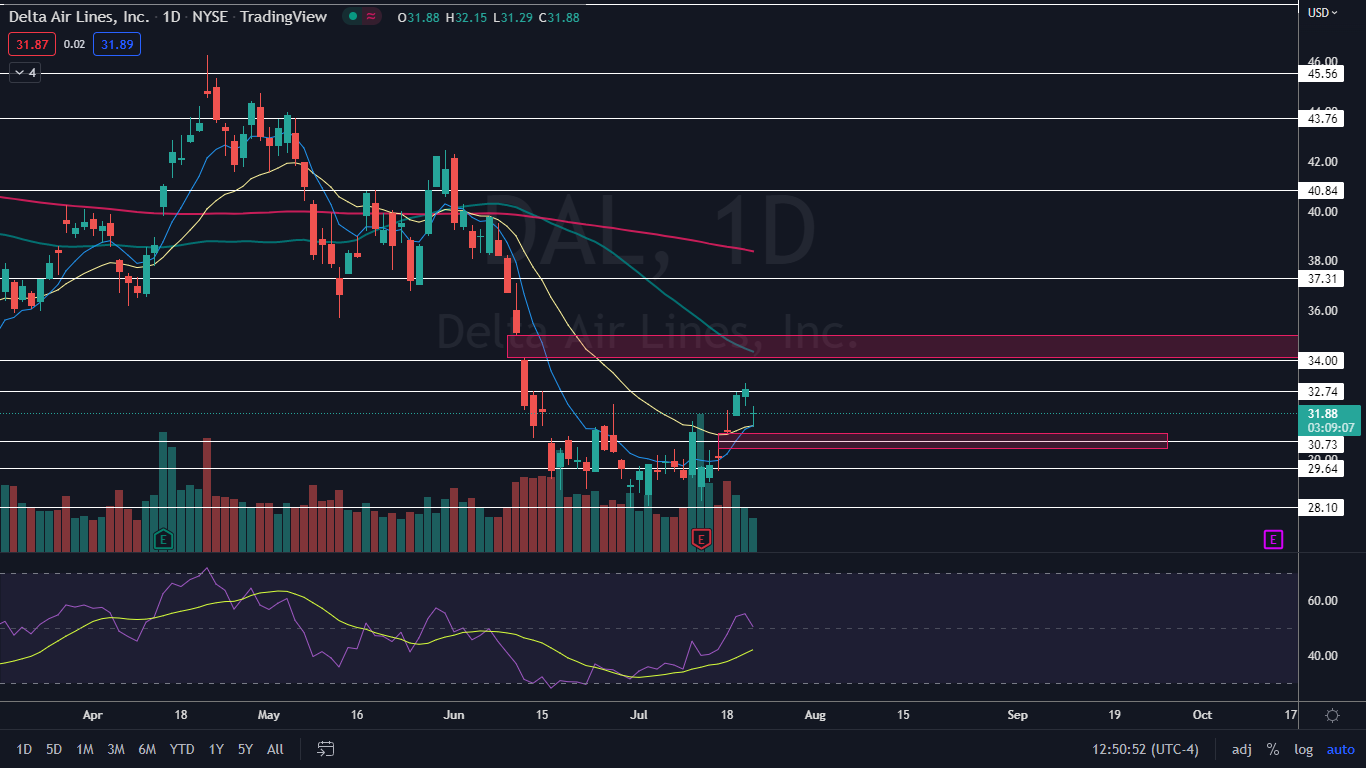
 The Delta Airlines Chart: Delta Airlines reversed course into an uptrend on July 5 after printing a bullish double bottom pattern on that date and June 30. The most recent higher low within the pattern was formed on July 13 at $28.35 and the most recent higher high was created at the $33.08 level on Wednesday.
- If Delta closes the trading day flat or near the high-of-day, the stock will print a doji or hammer candlestick, respectively, which could indicate the next higher low is in and the Delta will trade higher on Friday. If Delta closes the trading day below the eight-day exponential moving average, it could indicate the uptrend could soon be lost.
- Delta has resistance above at $32.74 and $34 and support below at $30.73 and $29.64.
 See Also: United Airlines, American Airlines And Some Other Big Stocks Moving Lower On Thursday
© 2024 Benzinga.com. Benzinga does not provide investment advice. All rights reserved.
Comments
Trade confidently with insights and alerts from analyst ratings, free reports and breaking news that affects the stocks you care about.

