


Buy and hold and investors hold through the ups and downs of the market, but shorter-term traders, such as swing traders, can't afford to waste time or capital holding through significant drawdowns.
The percentage of stocks above their 50-day simple moving average (SMA) is a tool swing traders can use to assess market conditions. When more than 50% of stocks are above their respective SMAs, it will generally be easier to make money on the long side because more than half of stocks are in uptrends.
The 50-day SMA is not a perfect measure of a trend, but it does provide a crude measure of whether a stock is moving up or down.
When less than 50% of stocks are above their 50-day SMA, more stocks are declining or choppy, generally making it harder to make money on the long side. This is the state of stock market currently, as it fell below the 50% indicator threshold in mid-April.
There are multiple versions of the indicator tracking different baskets of stocks. Two to consider using are:
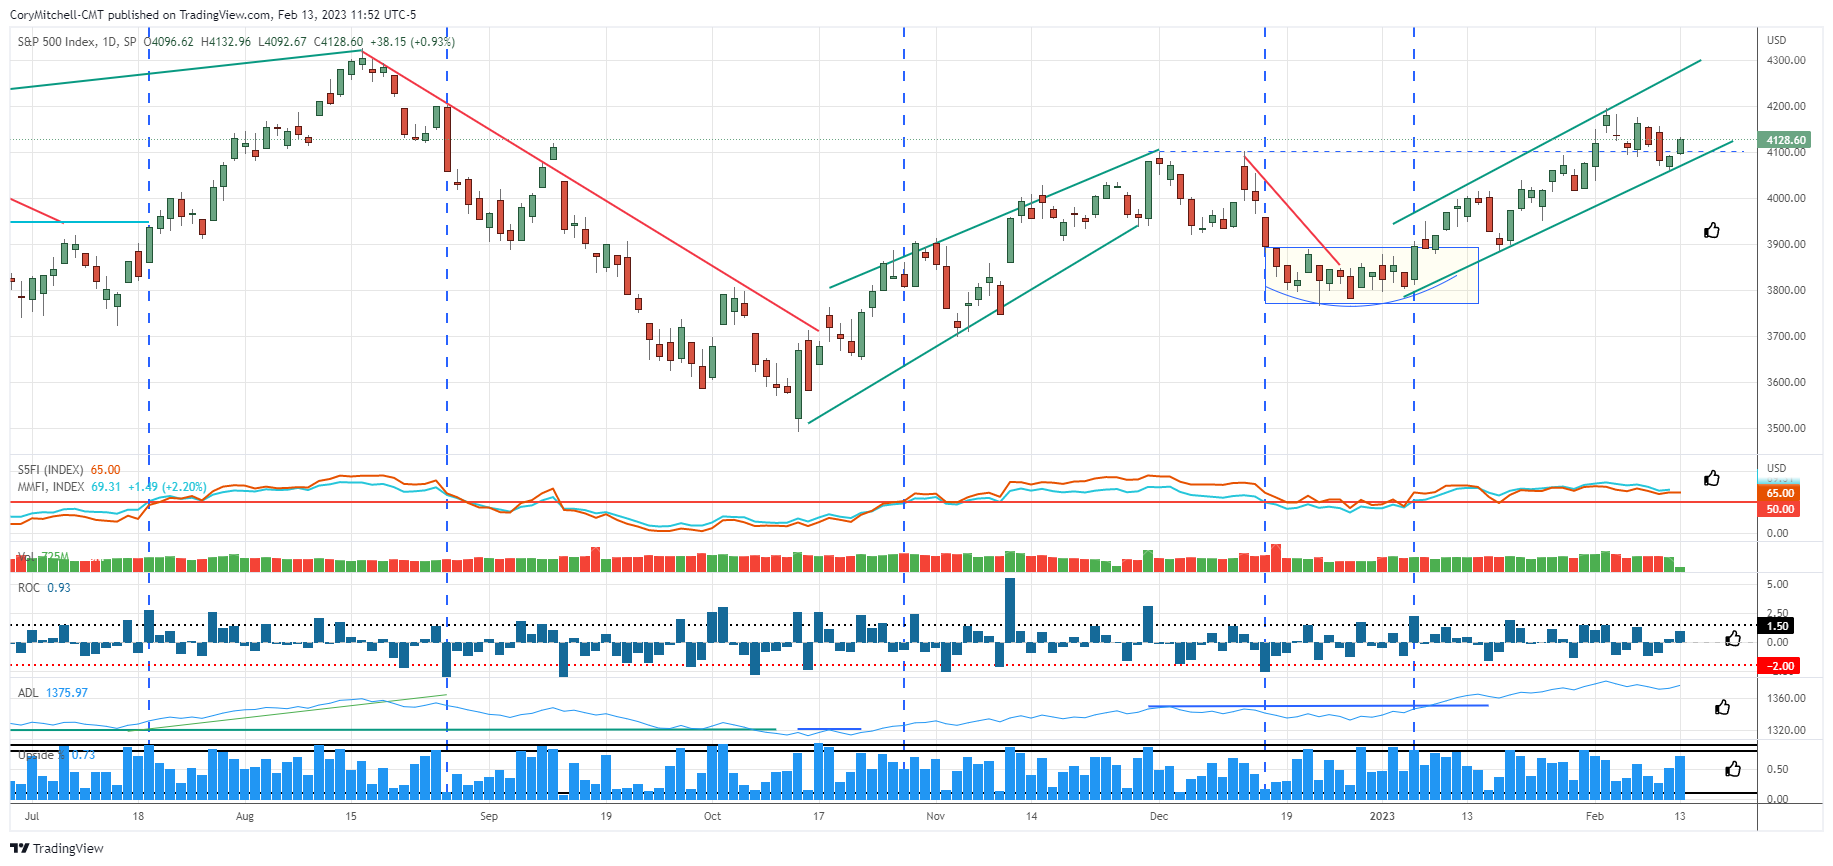
- % of S&P 500 stocks above their 50-day SMA
- % of all US stocks above their 50-day SMA
While they often move similarly, sometimes they may each tell a different story which can help traders assess underlying strengths or weaknesses.
On November 14, 2023, both indicators moved above the 50% line signaling more than 50% of stocks were trading above their 50-day moving averages or trending higher.
The S&P 500 breadth indicator stayed above 50 until April 12, 2024. When the indicator drops below 50% it indicates tougher conditions are underway for long traders, so avoid taking long trades until the indicator moves back above 50.
The "all US stocks" version of the indicator stayed above the 50 line from November until Feb. 5, 2024. It then whipsawed the 50 line until falling significantly below in early to mid-April.
That the "all US stocks" indicator was near 50 the last couple of months shows that many stocks were not participating in the rally underway in the S&P 500 SPY. While the index did move up from February to the end of March, the price action was rather choppy, compared to the stronger rally that occurred in late 2023 and early 2024.
How To Use The "% Of Stocks Above 50-Day" Indicator
The indicator isn't a red light/green light indicator. Rather it can be used to increase or decrease capital allocation. When the indicator(s) moves above 50 begin allocating some capital to individual stocks (swing trades). As conditions improve and current trades are working, allocate more capital.
As the indicator falls back to 50, avoid taking new long trades and consider moving stop loss orders near the current price on existing trades (trailing stop loss) to lock in profits as conditions deteriorate.
No indicator is perfect. This one doesn't pinpoint exact highs or lows in price, but it does highlight when conditions tend to be favorable for taking long trades and when conditions aren't.
If you like the idea of this indicator, study how it moves and decide how you will personally use it. Write it down in your Trading Plan - a written/typed document outlining how you will trade.
Where To Find These Breadth Indicators
The indicators can be found on various charting platforms. On Tradingview the symbols are S5FI (S&P 500 version) and MMFI (all US stocks version).
On StockCharts the symbol is $SPXA50R (S&P 500) and $NYA50R (NYSE...they don't have an "all" stocks version).
On other chart platforms, use the search box to find an index called "percent of stocks above 50" or some variation of that.
This is just one of multiple indicators that can be used to assess when a market bottom is like in and it is time to start buying again, or when a rallying is fading it is time to get conservative.
Disclaimer: The author owns S&P 500-related ETFs in a long-term buy-and-hold portfolio and is limiting short-term trade exposure on the long side until market conditions improve.
This article is from an unpaid external contributor. It does not represent Benzinga's reporting and has not been edited for content or accuracy.
© 2024 Benzinga.com. Benzinga does not provide investment advice. All rights reserved.
Trade confidently with insights and alerts from analyst ratings, free reports and breaking news that affects the stocks you care about.

