


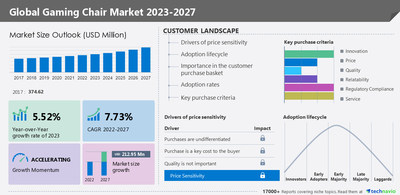
NEW YORK, Nov. 21, 2022 /PRNewswire/ -- The Global Gaming Chair Market share is set to increase by USD 212.95 million from 2022 to 2027. Moreover, the market's growth momentum will accelerate at a CAGR of 7.73% as per the latest market forecast report by Technavio. The market will also record a 5.52% Y-O-Y growth rate during the forecast period. To know more about the historic market size– Request a Free Sample Report!

Global Gaming Chair Market - Parent Market Analysis
Technavio categorizes the global gaming chair market as a part of the global leisure products industry within the global household durables market. The parent market, the global leisure products market, covers a variety of categories, including home fitness equipment, camping equipment, musical instruments, bicycles, toys, recreational vehicles, and other consumer-oriented games.
For more information parent market along with value chain analysis – Grab an Exclusive
sample!
Global Gaming Chair Market Characteristics with Five Forces–
The Global Gaming Chair Market is fragmented, and the five forces analysis by Technavio gives the accurate vision –
- Bargaining Power of Buyers
- The threat of New Entrants
- Threat of Rivalry
- Bargaining Power of Suppliers
- For information on the impact of the five forces analysis– Click Now!
Global Gaming Chair Market – Customer Landscape
- The disruption threats are strategic in nature, and operational risks for suppliers have been mapped based on their negative business impact and probability of occurrence.
- The potential for the customer landscape will be available with Technavio Reports – Buy Now!
Global Gaming Chair Market - Segmentation Assessment
Geography Segment Overview
Technavio's market research report entails detailed information on regional opportunities in store for vendors, which will assist in generating sales revenues. The Global Gaming Chair Market as per geography is categorized into North America, Europe, APAC, South America, and the Middle East and Africa. The report provides an accurate prediction of the contribution of all regions to the growth of the Global Gaming Chair Market size and actionable market understandings.
Regional Highlights
- APAC is the fastest-growing region in the global gaming chair market compared to other regions. 38% of the market's growth will originate from this region. The demand for gaming chairs is increasing significantly. Vendors of gaming chairs prefer manufacturing chairs that are compatible with new gaming hardware. The growth of the market in the region is driven by a rise in the number of people that are interested in playing video games professionally. A rise in online gaming and the growing disposable incomes of people are expected to drive the growth of the regional market.
Price Segment Overview
- The Global Gaming Chair Market as per price segmentation is categorized into Mid-range, Low-range, and High-range.
- Revenue Generating Segment - The gaming chair market share growth by the mid-range segment will be significant during the forecast period. Mid-range priced products are the most popular. Mid-range priced gaming chairs are equipped with proper armrests that help in lowering shoulder and arm pain. In addition, owing to their slightly higher price, they are equipped with decent-quality audio systems and sizable subwoofers.
Download a FREE Sample Report that can help you to strategize your sales
revenue - Get it now!
Global Gaming Chair Market – Market Dynamics
Major Driver Boosting the Market
- The health-related benefits of using gaming chairs are driving market growth.
- Gaming for a long time can lead to the development of medical issues such as carpal tunnel syndrome. Such issues can be avoided by using a proper gaming chair.
- A gaming chair with adjustable lumbar support and the right type of materials can help gamers prevent back injuries and wrist injuries.
- Such factors will drive the growth of the global gaming chair market during the forecast period.
Major Trends Influencing the Growth of the Market
- The emergence of ergonomic gaming chairs is a trend in the market.
- Ergonomic gaming chairs enable gamers to recline and rest their postural muscles.
- Some chairs have seat-side control, swivel and tilt capabilities, and neck pillows.
- Such features will increase the demand for gaming chairs among individual gamers.
- Thus, the emergence of ergonomic gaming chairs will support the global gaming chair market during the forecast period.
Major Challenges Interrupting the Market Growth
- The increasing adoption of mobile games is challenging the global gaming chair market growth.
- The adoption of multimedia and smart devices has increased over the past few years.
- The penetration of portable electronic devices such as tablets and smartphones has increased the demand for mobile games.
- Users can play games on gaming apps. Most of these apps are free and do not require additional controllers.
- Thus, the rise in the adoption of mobile gaming will hinder the market for gaming chairs during the forecast period.
To know about other factors of market dynamics – Request a Free Sample!
Technavio suggests three forecast scenarios (optimistic, probable, and pessimistic)
considering the impact of COVID-19. Technavio's in-depth research has direct and
indirect COVID-19-impacted market research reports.
Register for a free trial today and gain instant access to 17,000+ market research
reports.
Technavio's SUBSCRIPTION platform
Gaming Chair Market 2023-2027: Key Highlights
- CAGR of the market during the forecast period 2023-2027
- Detailed information on factors that will assist gaming chair market growth during the next five years
- Estimation of the gaming chair market size and its contribution to the parent market
- Predictions on upcoming trends and changes in consumer behavior
- The growth of the gaming chair market
- Analysis of the market's competitive landscape and detailed information on vendors
- Comprehensive details of factors that will challenge the growth of gaming chair market vendors
Related Reports
- The online gambling market is projected to grow by USD 142.38 billion during the forecast period 2021 to 2026. The market is segmented by device (desktop and mobile), product (lottery, betting, and casino), and geography (North America, Europe, APAC, South America, and the Middle East and Africa).
- The board games market is projected to grow by USD 3.02 billion with a CAGR of 7.31% during the forecast period 2021 to 2026. The market is segmented by distribution channel (online and offline), product (tabletop, card and dice, and role-playing), and geography (Europe, North America, APAC, Middle East and Africa, and South America).
Gaming Chair Market Scope | |
Report Coverage | Details |
Page number | 120 |
Base year | 2022 |
Historical year | 2017-2021 |
Forecast period | 2023-2027 |
Growth momentum & CAGR | Accelerate at a CAGR of 7.73% |
Market growth 2023-2027 | USD 212.95 million |
Market structure | Fragmented |
YoY growth (%) | 5.52 |
Regional analysis | APAC, North America, Europe, South America, and the Middle East and Africa |
Performing market contribution | APAC at 38% |
Key consumer countries | US, China, Japan, Germany, and UK |
Competitive landscape | Leading companies, Competitive Strategies, Consumer engagement scope |
Key companies profiled | Ace Casual Furniture, Aerocool Advanced Technologies Inc., AKRacing America Inc., AndaSeat, Arozzi North America, BRAZEN GAMING CHAIRS, Caseking GmbH, Clutch Chairz USA Ltd., Corsair Gaming Inc., DXRacer USA LLC., GT Omega Racing Ltd., Herman Miller Inc., Impakt SA, LF Gaming, NOBLECHAIRS, Playseat BV, Raidmax, Roto VR Ltd., Secretlab SG Pte. Ltd., Thermaltake Technology Co. Ltd., ThunderX3, and Vertagear Inc |
Market dynamics | Parent market analysis, Market growth inducers and obstacles, Fast-growing and slow-growing segment analysis, COVID-19 impact and recovery analysis and future consumer dynamics, and Market condition analysis for the forecast period. |
Customization purview | If our report has not included the data that you are looking for, you can reach out to our analysts and get segments customized. |
Browse Consumer Discretionary Market Reports
Table of Contents
1 Executive Summary
- 1.1 Market overview
- Exhibit 01: Executive Summary – Chart on Market Overview
- Exhibit 02: Executive Summary – Data Table on Market Overview
- Exhibit 03: Executive Summary – Chart on Global Market Characteristics
- Exhibit 04: Executive Summary – Chart on Market by Geography
- Exhibit 05: Executive Summary – Chart on Market Segmentation by Price
- Exhibit 06: Executive Summary – Chart on Market Segmentation by Type
- Exhibit 07: Executive Summary – Chart on Incremental Growth
- Exhibit 08: Executive Summary – Data Table on Incremental Growth
- Exhibit 09: Executive Summary – Chart on Vendor Market Positioning
2 Market Landscape
- 2.1 Market ecosystem
- Exhibit 10: Parent market
- Exhibit 11: Market Characteristics
3 Market Sizing
- 3.1 Market definition
- Exhibit 12: Offerings of vendors included in the market definition
- 3.2 Market segment analysis
- Exhibit 13: Market segments
- 3.3 Market size 2022
- 3.4 Market outlook: Forecast for 2022-2027
- Exhibit 14: Chart on Global - Market size and forecast 2022-2027 ($ million)
- Exhibit 15: Data Table on Global - Market size and forecast 2022-2027 ($ million)
- Exhibit 16: Chart on Global Market: Year-over-year growth 2022-2027 (%)
- Exhibit 17: Data Table on Global Market: Year-over-year growth 2022-2027 (%)
4 Historic Market Size
- 4.1 Global gaming chair market 2017 - 2021
- Exhibit 18: Historic Market Size – Data Table on Global gaming chair market 2017 - 2021 ($ million)
- 4.2 Price Segment Analysis 2017 - 2021
- Exhibit 19: Historic Market Size – Price Segment 2017 - 2021 ($ million)
- 4.3 Type Segment Analysis 2017 - 2021
- Exhibit 20: Historic Market Size – Type Segment 2017 - 2021 ($ million)
- 4.4 Geography Segment Analysis 2017 - 2021
- Exhibit 21: Historic Market Size – Geography Segment 2017 - 2021 ($ million)
- 4.5 Country Segment Analysis 2017 - 2021
- Exhibit 22: Historic Market Size – Country Segment 2017 - 2021 ($ million)
5 Five Forces Analysis
- 5.1 Five forces summary
- Exhibit 23: Five forces analysis - Comparison between2022 and 2027
- 5.2 Bargaining power of buyers
- Exhibit 24: Chart on Bargaining power of buyers – Impact of key factors 2022 and 2027
- 5.3 Bargaining power of suppliers
- Exhibit 25: Bargaining power of suppliers – Impact of key factors in 2022 and 2027
- 5.4 Threat of new entrants
- Exhibit 26: Threat of new entrants – Impact of key factors in 2022 and 2027
- 5.5 Threat of substitutes
- Exhibit 27: Threat of substitutes – Impact of key factors in 2022 and 2027
- 5.6 Threat of rivalry
- Exhibit 28: Threat of rivalry – Impact of key factors in 2022 and 2027
- 5.7 Market condition
- Exhibit 29: Chart on Market condition - Five forces 2022 and 2027
6 Market Segmentation by Price
- 6.1 Market segments
- Exhibit 30: Chart on Price - Market share 2022-2027 (%)
- Exhibit 31: Data Table on Price - Market share 2022-2027 (%)
- 6.2 Comparison by Price
- Exhibit 32: Chart on Comparison by Price
- Exhibit 33: Data Table on Comparison by Price
- 6.3 Mid-range - Market size and forecast 2022-2027
- Exhibit 34: Chart on Mid-range - Market size and forecast 2022-2027 ($ million)
- Exhibit 35: Data Table on Mid-range - Market size and forecast 2022-2027 ($ million)
- Exhibit 36: Chart on Mid-range - Year-over-year growth 2022-2027 (%)
- Exhibit 37: Data Table on Mid-range - Year-over-year growth 2022-2027 (%)
- 6.4 Low-range - Market size and forecast 2022-2027
- Exhibit 38: Chart on Low-range - Market size and forecast 2022-2027 ($ million)
- Exhibit 39: Data Table on Low-range - Market size and forecast 2022-2027 ($ million)
- Exhibit 40: Chart on Low-range - Year-over-year growth 2022-2027 (%)
- Exhibit 41: Data Table on Low-range - Year-over-year growth 2022-2027 (%)
- 6.5 High-range - Market size and forecast 2022-2027
- Exhibit 42: Chart on High-range - Market size and forecast 2022-2027 ($ million)
- Exhibit 43: Data Table on High-range - Market size and forecast 2022-2027 ($ million)
- Exhibit 44: Chart on High-range - Year-over-year growth 2022-2027 (%)
- Exhibit 45: Data Table on High-range - Year-over-year growth 2022-2027 (%)
- 6.6 Market opportunity by Price
- Exhibit 46: Market opportunity by Price ($ million)
7 Market Segmentation by Type
- 7.1 Market segments
- Exhibit 47: Chart on Type - Market share 2022-2027 (%)
- Exhibit 48: Data Table on Type - Market share 2022-2027 (%)
- 7.2 Comparison by Type
- Exhibit 49: Chart on Comparison by Type
- Exhibit 50: Data Table on Comparison by Type
- 7.3 Table - Market size and forecast 2022-2027
- Exhibit 51: Chart on Table - Market size and forecast 2022-2027 ($ million)
- Exhibit 52: Data Table on Table - Market size and forecast 2022-2027 ($ million)
- Exhibit 53: Chart on Table - Year-over-year growth 2022-2027 (%)
- Exhibit 54: Data Table on Table - Year-over-year growth 2022-2027 (%)
- 7.4 Hybrid - Market size and forecast 2022-2027
- Exhibit 55: Chart on Hybrid - Market size and forecast 2022-2027 ($ million)
- Exhibit 56: Data Table on Hybrid - Market size and forecast 2022-2027 ($ million)
- Exhibit 57: Chart on Hybrid - Year-over-year growth 2022-2027 (%)
- Exhibit 58: Data Table on Hybrid - Year-over-year growth 2022-2027 (%)
- 7.5 Platform - Market size and forecast 2022-2027
- Exhibit 59: Chart on Platform - Market size and forecast 2022-2027 ($ million)
- Exhibit 60: Data Table on Platform - Market size and forecast 2022-2027 ($ million)
- Exhibit 61: Chart on Platform - Year-over-year growth 2022-2027 (%)
- Exhibit 62: Data Table on Platform - Year-over-year growth 2022-2027 (%)
- 7.6 Market opportunity by Type
- Exhibit 63: Market opportunity by Type ($ million)
8 Customer Landscape
- 8.1 Customer landscape overview
- Exhibit 64: Analysis of price sensitivity, lifecycle, customer purchase basket, adoption rates, and purchase criteria
9 Geographic Landscape
- 9.1 Geographic segmentation
- Exhibit 65: Chart on Market share by geography 2022-2027 (%)
- Exhibit 66: Data Table on Market share by geography 2022-2027 (%)
- 9.2 Geographic comparison
- Exhibit 67: Chart on Geographic comparison
- Exhibit 68: Data Table on Geographic comparison
- 9.3 APAC - Market size and forecast 2022-2027
- Exhibit 69: Chart on APAC - Market size and forecast 2022-2027 ($ million)
- Exhibit 70: Data Table on APAC - Market size and forecast 2022-2027 ($ million)
- Exhibit 71: Chart on APAC - Year-over-year growth 2022-2027 (%)
- Exhibit 72: Data Table on APAC - Year-over-year growth 2022-2027 (%)
- 9.4 North America - Market size and forecast 2022-2027
- Exhibit 73: Chart on North America - Market size and forecast 2022-2027 ($ million)
- Exhibit 74: Data Table on North America - Market size and forecast 2022-2027 ($ million)
- Exhibit 75: Chart on North America - Year-over-year growth 2022-2027 (%)
- Exhibit 76: Data Table on North America - Year-over-year growth 2022-2027 (%)
- 9.5 Europe - Market size and forecast 2022-2027
- Exhibit 77: Chart on Europe - Market size and forecast 2022-2027 ($ million)
- Exhibit 78: Data Table on Europe - Market size and forecast 2022-2027 ($ million)
- Exhibit 79: Chart on Europe - Year-over-year growth 2022-2027 (%)
- Exhibit 80: Data Table on Europe - Year-over-year growth 2022-2027 (%)
- 9.6 South America - Market size and forecast 2022-2027
- Exhibit 81: Chart on South America - Market size and forecast 2022-2027 ($ million)
- Exhibit 82: Data Table on South America - Market size and forecast 2022-2027 ($ million)
- Exhibit 83: Chart on South America - Year-over-year growth 2022-2027 (%)
- Exhibit 84: Data Table on South America - Year-over-year growth 2022-2027 (%)
- 9.7 Middle East and Africa - Market size and forecast 2022-2027
- Exhibit 85: Chart on Middle East and Africa - Market size and forecast 2022-2027 ($ million)
- Exhibit 86: Data Table on Middle East and Africa - Market size and forecast 2022-2027 ($ million)
- Exhibit 87: Chart on Middle East and Africa - Year-over-year growth 2022-2027 (%)
- Exhibit 88: Data Table on Middle East and Africa - Year-over-year growth 2022-2027 (%)
- 9.8 US - Market size and forecast 2022-2027
- Exhibit 89: Chart on US - Market size and forecast 2022-2027 ($ million)
- Exhibit 90: Data Table on US - Market size and forecast 2022-2027 ($ million)
- Exhibit 91: Chart on US - Year-over-year growth 2022-2027 (%)
- Exhibit 92: Data Table on US - Year-over-year growth 2022-2027 (%)
- 9.9 China - Market size and forecast 2022-2027
- Exhibit 93: Chart on China - Market size and forecast 2022-2027 ($ million)
- Exhibit 94: Data Table on China - Market size and forecast 2022-2027 ($ million)
- Exhibit 95: Chart on China - Year-over-year growth 2022-2027 (%)
- Exhibit 96: Data Table on China - Year-over-year growth 2022-2027 (%)
- 9.10 Japan - Market size and forecast 2022-2027
- Exhibit 97: Chart on Japan - Market size and forecast 2022-2027 ($ million)
- Exhibit 98: Data Table on Japan - Market size and forecast 2022-2027 ($ million)
- Exhibit 99: Chart on Japan - Year-over-year growth 2022-2027 (%)
- Exhibit 100: Data Table on Japan - Year-over-year growth 2022-2027 (%)
- 9.11 Germany - Market size and forecast 2022-2027
- Exhibit 101: Chart on Germany - Market size and forecast 2022-2027 ($ million)
- Exhibit 102: Data Table on Germany - Market size and forecast 2022-2027 ($ million)
- Exhibit 103: Chart on Germany - Year-over-year growth 2022-2027 (%)
- Exhibit 104: Data Table on Germany - Year-over-year growth 2022-2027 (%)
- 9.12 UK - Market size and forecast 2022-2027
- Exhibit 105: Chart on UK - Market size and forecast 2022-2027 ($ million)
- Exhibit 106: Data Table on UK - Market size and forecast 2022-2027 ($ million)
- Exhibit 107: Chart on UK - Year-over-year growth 2022-2027 (%)
- Exhibit 108: Data Table on UK - Year-over-year growth 2022-2027 (%)
- 9.13 Market opportunity by geography
- Exhibit 109: Market opportunity by geography ($ million)
10 Drivers, Challenges, and Trends
- 10.1 Market drivers
- 10.2 Market challenges
- 10.3 Impact of drivers and challenges
- Exhibit 110: Impact of drivers and challenges in 2022 and 2027
- 10.4 Market trends
11 Vendor Landscape
- 11.1 Overview
- 11.2 Vendor landscape
- Exhibit 111: Overview on Criticality of inputs and Factors of differentiation
- 11.3 Landscape disruption
- Exhibit 112: Overview on factors of disruption
- 11.4 Industry risks
- Exhibit 113: Impact of key risks on business
12 Vendor Analysis
- 12.1 Vendors covered
- Exhibit 114: Vendors covered
- 12.2 Market positioning of vendors
- Exhibit 115: Matrix on vendor position and classification
- 12.3 Ace Casual Furniture
- Exhibit 116: Ace Casual Furniture - Overview
- Exhibit 117: Ace Casual Furniture - Product / Service
- Exhibit 118: Ace Casual Furniture - Key offerings
- 12.4 Aerocool Advanced Technologies Inc.
- Exhibit 119: Aerocool Advanced Technologies Inc. - Overview
- Exhibit 120: Aerocool Advanced Technologies Inc. - Product / Service
- Exhibit 121: Aerocool Advanced Technologies Inc. - Key offerings
- 12.5 AKRacing America Inc.
- Exhibit 122: AKRacing America Inc. - Overview
- Exhibit 123: AKRacing America Inc. - Product / Service
- Exhibit 124: AKRacing America Inc. - Key offerings
- 12.6 Arozzi North America
- Exhibit 125: Arozzi North America - Overview
- Exhibit 126: Arozzi North America - Product / Service
- Exhibit 127: Arozzi North America - Key offerings
- 12.7 Caseking GmbH
- Exhibit 128: Caseking GmbH - Overview
- Exhibit 129: Caseking GmbH - Product / Service
- Exhibit 130: Caseking GmbH - Key offerings
- 12.8 Clutch Chairz USA Ltd.
- Exhibit 131: Clutch Chairz USA Ltd. - Overview
- Exhibit 132: Clutch Chairz USA Ltd. - Product / Service
- Exhibit 133: Clutch Chairz USA Ltd. - Key offerings
- 12.9 Corsair Gaming Inc.
- Exhibit 134: Corsair Gaming Inc. - Overview
- Exhibit 135: Corsair Gaming Inc. - Business segments
- Exhibit 136: Corsair Gaming Inc. - Key news
- Exhibit 137: Corsair Gaming Inc. - Key offerings
- Exhibit 138: Corsair Gaming Inc. - Segment focus
- 12.10 DXRacer USA LLC.
- Exhibit 139: DXRacer USA LLC. - Overview
- Exhibit 140: DXRacer USA LLC. - Product / Service
- Exhibit 141: DXRacer USA LLC. - Key offerings
- 12.11 GT Omega Racing Ltd.
- Exhibit 142: GT Omega Racing Ltd. - Overview
- Exhibit 143: GT Omega Racing Ltd. - Product / Service
- Exhibit 144: GT Omega Racing Ltd. - Key offerings
- 12.12 Impakt SA
- Exhibit 145: Impakt SA - Overview
- Exhibit 146: Impakt SA - Product / Service
- Exhibit 147: Impakt SA - Key offerings
- 12.13 NOBLECHAIRS
- Exhibit 148: NOBLECHAIRS - Overview
- Exhibit 149: NOBLECHAIRS - Product / Service
- Exhibit 150: NOBLECHAIRS - Key offerings
- 12.14 Raidmax
- Exhibit 151: Raidmax - Overview
- Exhibit 152: Raidmax - Product / Service
- Exhibit 153: Raidmax - Key offerings
- 12.15 Secretlab SG Pte. Ltd.
- Exhibit 154: Secretlab SG Pte. Ltd. - Overview
- Exhibit 155: Secretlab SG Pte. Ltd. - Product / Service
- Exhibit 156: Secretlab SG Pte. Ltd. - Key offerings
- 12.16 Thermaltake Technology Co. Ltd.
- Exhibit 157: Thermaltake Technology Co. Ltd. - Overview
- Exhibit 158: Thermaltake Technology Co. Ltd. - Product / Service
- Exhibit 159: Thermaltake Technology Co. Ltd. - Key offerings
- 12.17 ThunderX3
- Exhibit 160: ThunderX3 - Overview
- Exhibit 161: ThunderX3 - Product / Service
- Exhibit 162: ThunderX3 - Key offerings
13 Appendix
- 13.1 Scope of the report
- 13.2 Inclusions and exclusions checklist
- Exhibit 163: Inclusions checklist
- Exhibit 164: Exclusions checklist
- 13.3 Currency conversion rates for US$
- Exhibit 165: Currency conversion rates for US$
- 13.4 Research methodology
- Exhibit 166: Research methodology
- Exhibit 167: Validation techniques employed for market sizing
- Exhibit 168: Information sources
- 13.5 List of abbreviations
- Exhibit 169: List of abbreviations
About Us
Technavio is a leading global technology research and advisory company. Their research and analysis focus on emerging market trends and provide actionable insights to help businesses identify market opportunities and develop effective strategies to optimize their market positions. With over 500 specialized analysts, Technavio's report library consists of more than 17,000 reports and counting, covering 800 technologies, spanning 50 countries. Their client base consists of enterprises of all sizes, including more than 100 Fortune 500 companies. This growing client base relies on Technavio's comprehensive coverage, extensive research, and actionable market insights to identify opportunities in existing and potential markets and assess their competitive positions within changing market scenarios.
Contact
Technavio Research
Jesse Maida
Media & Marketing Executive
US: +1 844 364 1100
UK: +44 203 893 3200
Email: media@technavio.com
Website: www.technavio.com/


SOURCE Technavio
© 2024 Benzinga.com. Benzinga does not provide investment advice. All rights reserved.
Trade confidently with insights and alerts from analyst ratings, free reports and breaking news that affects the stocks you care about.

