


(Monday Market Open) Friday’s jobs report really put the Federal Reserve in a tough place.
While recession fears haven’t vanished, it’s tough to forecast an economic downturn with half a million people hired, upward revisions for the two prior months, and confirmation of wide breadth of jobs growth nearly across the board—all in a single report.
It was quite simply a blockbuster.
Many think this opens the door to more Fed rate hikes. Fed Chairman Jerome Powell is scheduled to speak at midday in Washington tomorrow, which could be investors’ first chance to hear his take on the data. Other Fed speeches are sprinkled throughout the week, with a heavy load on Wednesday, in particular. Treasury auctions could also be worth a look.
This week isn’t quite as crazy on the earnings calendar, but it isn’t a vacation, either. Some of the key company reports to watch include PepsiCo PEP, AbbVie ABBV, Uber UBER, BP BP, and Under Armour UAA. And perhaps biggest of all, Disney (DIS) is set to go Wednesday after the close.
In general, investors have been buying the dips lately, even in shares of companies like Apple AAPL that reported disappointing results. Will that continue this week as caution appears to be rising amid geopolitical tensions with China? Stay tuned.
Fed Thoughts
While the Fed doesn’t want to send the economy into a recession with tighter policy, it wants to slay the inflation dragon. With jobs growth surging even as inflation eases, the takeaway, perhaps, is that the Fed can have its cake and eat it too. The hikes don’t appear to be hurting jobs and wages but do appear to be slowing inflation. So why not continue?
After all, earnings reports keep disappointing and earnings projections keep falling, supporting the slowing economy argument. Q4 earnings are now expected to slide 5.3%, according to research firm FactSet, down from the previous estimate for a 5% drop.
To date, only 70% of S&P 500® companies have beaten Wall Street’s earnings-per-share estimates in Q4. Why the “only?” According to Randy Frederick, Managing Director of Trading and Derivatives Schwab Center for Financial Research, since Q1 2020, that average has been 80%.
This means the S&P 500 index’s (SPX) price-earnings ratio (P/E) is rising despite Friday’s pullback in the markets. As of today, the S&P’s forward P/E is 18.4, above the 10-year average of 17.2 and above 17 late last year.
And when P rises and E falls, it’s generally not a bullish trend.
Meanwhile, the futures markets pencil in a likely 25-basis point Fed rate hike next month, but things look more up in the air after that. By and large, there continues to be a disconnect. The markets are still looking for a rate cut by the end of the year, and that might be too optimistic.
Morning rush
- The 10-year Treasury yield (TNX) rose sharply to 3.59%.
- The U.S. Dollar Index ($DXY) is up to 103.2.
- Cboe Volatility Index® (VIX) climbed to 19.45
- WTI Crude Oil (/CL) rose nearly 1% to $74.03 per barrel.
Treasuries came under pressure Friday not just from the strong jobs report but after an Institute for Supply Management (ISM) services report showing expansion in January. The inverted yield curve steepened last week. The pressure on fixed income continued early Monday.
Thinking cap
The buzz continues today from Friday’s off-the-charts jobs report. Here are a few post-weekend thoughts:
- Jobs grew most in leisure and hospitality, another sign that Americans are going back out to play now that COVID-19 is receding. This speaks to the health of a bunch of industries like casinos, restaurants, hotels, and airlines. We’ve heard earnings from a few of these companies, and they mostly back up what the job numbers say. But prices are rising for restaurant meals and airline tickets, so it’s possible the services industry could become a victim of its own success.
- Positions also rose in manufacturing and construction. Fed Chairman Jerome Powell emphasized Wednesday that the goods sector has calmed a lot and we just need services to ease for inflation to cool toward the Fed’s target 2% level. However, this jobs report sends a signal that goods producers aren’t down for the count. It’s a backward-looking view, of course, so let’s see if February’s numbers reinforce that goods-producing growth is continuing.
- Perhaps this surprising increase in hires could start to narrow the gap between open positions and people available to fill them. The unemployment rate is 3.4%, a 50-year low, and there were 11 million job openings as of December. Perhaps the January Job Openings and Labor Turnover Survey (JOLTS) will show many of those positions getting filled. A narrower gap between jobs and workers could potentially slow wage growth. That’s important because when wages rise, people generally feel comfortable spending more, and that demand further fuels inflation.
- While the report showed no change in labor force participation, which remained at a low 62.4%, it seems possible more people are in the workforce. How else would companies add so many jobs at once? This could reflect lots of things, but don’t discount “unretirements,” meaning people who retired during the pandemic only to re-enter the labor market now that inflation has put more pressure on household expenses.
Reviewing the market minutes
Imagine someone told you a week ago that the coming week would feature hawkish rate increase talk from the Fed, disappointing earnings from Apple (AAPL), Alphabet (GOOGL), and Amazon (AMZN), and a January jobs report showing nearly three times the expected job creation. Hearing those factors, you might’ve expected a dramatic decline on Wall Street.
Those events happened, but investors probably went home Friday disappointed that the SPX climbed only 1.6% for the week after a 3% gain at one point. If you didn’t like the way things finished, it’s kind of like getting a surprise prime steak dinner and then being upset there wasn’t any pudding for dessert. Even with Friday’s sharp losses amid re-emerging inflation fears from the jobs report, it wasn’t a bad week. The major indexes remain near five-month highs.
The Nasdaq Composite® ($COMP) did swing moderately lower Friday after Thursday’s 3% gains. AMZN fell 8%, playing a major role in the $COMP’s struggles. GOOGL also fell more than 2%, but AAPL quickly regained footing after early weakness to post 2% gains. AAPL’s ability to climb despite missing Wall Street’s forecast for almost every major part of its business could suggest optimism about China and its supply chains. The thinking (or hope) might be that AAPL can quickly overcome some of logistical problems it experienced in the latest quarter. Time will tell.
Here’s how the major indexes performed Friday:
- The Dow Jones Industrial Average® ($DJI) fell 128 points, or 0.4%, to 33,926.
- The $COMP dropped 1.59% to 12,006.
- The Russell 2000® (RUT) slipped 0.88% to 1,983.
- The SPX dipped 43 points, or 1.04%, to 4,136, up 1.6% from the previous Friday’s close of 4,070.
Talking technicals: How can we explain Wall Street’s surprising resilience Friday after new inflation worries were sparked by January’s hot jobs report? It might be easier to understand by looking at the charts. This week, the SPX finally delivered a “golden cross,” where the 50-day moving average climbs above the 200-day moving average (see chart below). This is considered a major indicator of positive momentum and may have triggered technical buying.
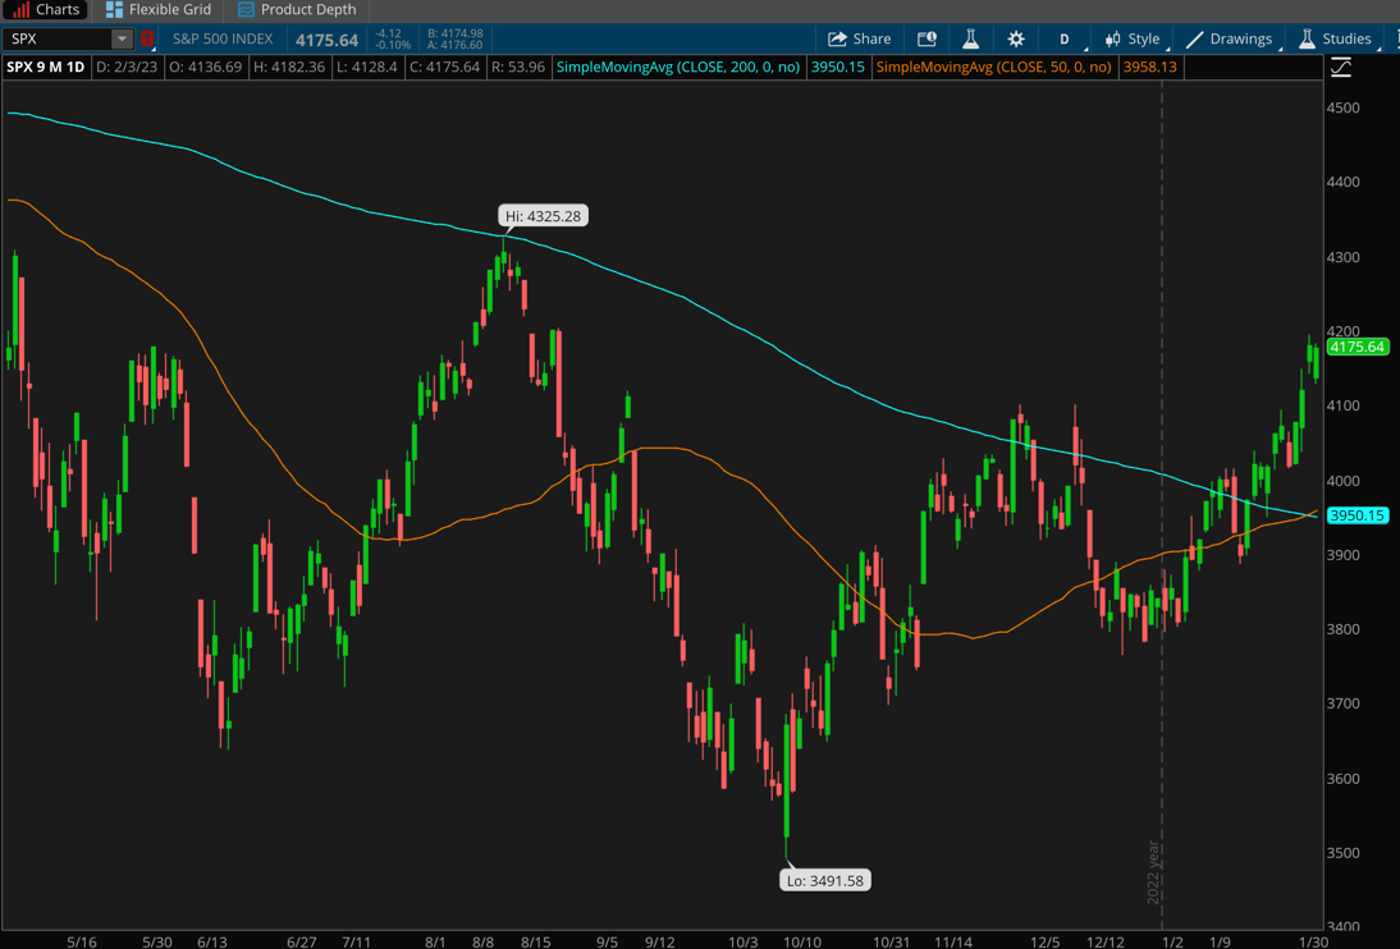
CHART OF THE DAY: GOING FOR THE GOLD. This chart of the S&P 500 index (SPX—candlesticks) indicates exactly where the SPX experienced a “golden cross” in which the 50-day moving average (red line) crossed above the 200-day moving average (blue). Data source: S&P Dow Jones Indices. Chart source: The thinkorswim® platform. For illustrative purposes only. Past performance does not guarantee future results.
Three Things to Watch
Over a barrel: Wall Street’s struggles last year included rising gas prices. Last summer’s 14-year highs at the pump last summer led the Biden administration to aggressively tap the Strategic Petroleum Reserve (SPR) after Russia invaded Ukraine. That ultimately sapped U.S. supplies, keeping crude prices supported after the initial SPR injections into the market were depleted. Recently, crude oil stockpiles have come surging back, helping bring down prices at the pump. U.S. commercial crude inventories (excluding SPR) increased by 4.1 million barrels last week, the Energy Information Administration (EIA) reported. Crude prices are down the last two weeks, sinking to nearly one-month lows under $74 per barrel Friday, though dollar strength probably had a role.
Curious correlations: When stocks sank in October and again in December, Gold futures (/GC) went the opposite way, climbing amid the same inflation fears that dragged down Wall Street (investors often embrace gold when inflation surges). Since then, things have changed. Gold rallied along with stocks for most of January before turning lower late last week when stocks hit a brief roadblock. In other words, stocks and gold suddenly seem correlated, the opposite of the situation late last year. What does this mean? When gold and stocks rally together it could be a sign of investors generally becoming more aggressive about embracing risk, which tends to be bullish for growth stocks.
Bull target: The SPX put in its 2022 closing low on October 12 at 3,577. At that point, an ice cold bear market had Wall Street firmly in its grip. Now, four months later, the possibility of a new bull market is in sight. A close of 4,292 or higher in the SPX, only about 100 points away from where the index traded at one point Friday, would represent a 20% gain from the October 12 close, the textbook definition of a bull market. The last bull market stretched from March 23, 2020 – January 3, 2022 an SPX gain of 114%. That sounds like a lot, but the previous bull run from 2009 – 2020 produced a 400% gain. However, triple-digit stock market climbs seem a lot harder to envision given our current rate environment. Also, the forward price-earnings (P/E) multiple for the SPX is above 18. That’s higher than normal, historically. In contrast, the 2009 bull market began with the SPX’s forward P/E multiple below 12. It’s easier to go on a tear if stocks begin the rally historically underpriced.
Notable calendar items
Feb. 7: December Trade Balance and Consumer Credit and expected earnings from BP (BP), Centene (CNC), and Hertz (HTZ)
Feb. 8: December Wholesale Inventories and expected earnings from Bunge (BG), Uber (UBER), and Yum Brands (YUM)
Feb. 9: Weekly Initial Jobless Claims and expected earnings from AbbVie (ABBV), AstraZeneca (AZN), Baxter (BAX), and PepsiCo (PEP)
Feb. 10: University of Michigan February Consumer Sentiment and expected earnings from Enbridge (ENB) and Honda Motor (HMC)
Feb. 13: No major earnings or data of note
Feb. 14: January Consumer Price Index (CPI) and expected earnings from Coca-Cola (KO) and Marriott (MAR)
Feb. 15: January Retail Sales, January Capacity Utilization and Industrial Production, and expected earnings from Biogen (BIIB) and Kraft Heinz (KHC)
TD Ameritrade® commentary for educational purposes only. Member SIPC.
Image sourced from Shutterstock
This post contains sponsored advertising content. This content is for informational purposes only and not intended to be investing advice.
Edge Rankings
Price Trend
© 2025 Benzinga.com. Benzinga does not provide investment advice. All rights reserved.
Trade confidently with insights and alerts from analyst ratings, free reports and breaking news that affects the stocks you care about.

