


On Friday, the market experienced broad selling across stocks, yields, and commodities. The news of the omicron COVID-19 variant triggered some panic selling on a low-volume day. The Dow Jones Industrial Average ($DJI) fell 2.5%, which was the biggest one-day drop since October of 2020. The S&P 500 (SPX) fell 2.3% and the Nasdaq Composite GIDS fell 2.2%. In other markets, Crude oil (/CL) fell more than 11% and the 10-year Treasury Yield (TNX) dropped to 1.48% from 1.64%.
However, it appears that cooler heads may be prevailing as equity index futures and oil prices are rebounding ahead of the open. With more investors returning from the holiday, the market can better discount the severity of the news. The Cboe Volatility Index (VIX) which had spiked above 28 has dropped more than 15% before the open. Of course, the omicron variant is new, and more news will be coming out, so we aren’t out of the woods yet.
The variant news didn’t seem to keep consumers out of the stores because brick-and-mortar stores saw more shoppers spending more time and money than last year. According to the Wall Street Journal, there were fewer discounts because of the early shopping season.
This week has a busy earnings calendar, but very few major announcements. Before the bell, Chinese EV maker Li Auto (LI) reported better-than-expected earnings and revenue which prompted the stock to rally more than 9% in premarket trading.
Taper Off?
As you probably know, the Federal Reserve has been purchasing Treasuries and mortgage-backed securities to help stimulate economic growth by providing liquidity in the money markets and keeping interest rates low along the yield curve. The Fed announced earlier this month it would start tapering or reduce the number of bond purchases in December at a rate at which purchases would end in June of 2022. However, there seems to already be a push to speed up the taper.
Two weeks ago, Atlanta Fed President Bostic gave a speech saying the Fed should consider speeding up the taper because of rising inflation and a stronger employment picture. Last week, San Francisco Fed President Mary Daly agreed that the taper should be sped up if inflation continues to rise and employment continues to grow. However, these aren’t the only Fed members talking about it. On November 15, Richmond Fed President Tom Barkin also said he would be open to a conversation of faster tapering if the data supported it. On November 19, Fed Governor Christopher Waller said he’d like “to go early and go fast on tapering.” So, it sounds as if there’s a growing appetite to speed up the tapering.
So, what is the data showing? Last week, just before the Thanksgiving holiday, the weekly jobless claims came in below 200,000, which was a 52-year low. The PCE Price Index showed inflation growing at 5.3% from October 2020 to October 2021. This week, we’ll see more jobs data with the big November Employment Situation report on Friday. The November Consumer Price Index (CPI) is scheduled for release on December 13. Then the Fed will meet again on December 15, which is where it’ll likely determine if it wants to speed up the taper.
Treasury yields have already been changing as the market anticipates the Fed’s tapering plans. Last week, President Joe Biden renominated Fed Chair Jerome Powell to another term. Yields rose on the news as bond investors seemed to see Powell as more hawkish than the other frontrunner, Lael Brainard. The biggest movements have been toward the front of the curve, with the one-year Treasury yield climbing 40% and the 3-month, 2-year, and 3-year yields rising 20% each.
The 10-year-Treasury Index (TNX) tracks changes in the 10-year Treasury yield. The TNX hit an all-time low in March of 2020 in response to the Federal Reserve and Congressional actions related to the COVID-19 pandemic. However, the TNX has risen to an area of congestion that has been around since the 2008 credit crisis. In the past, this has been a difficult area for the TNX break above, but with the taper, there may be less resistance here because the Fed will be buying less.
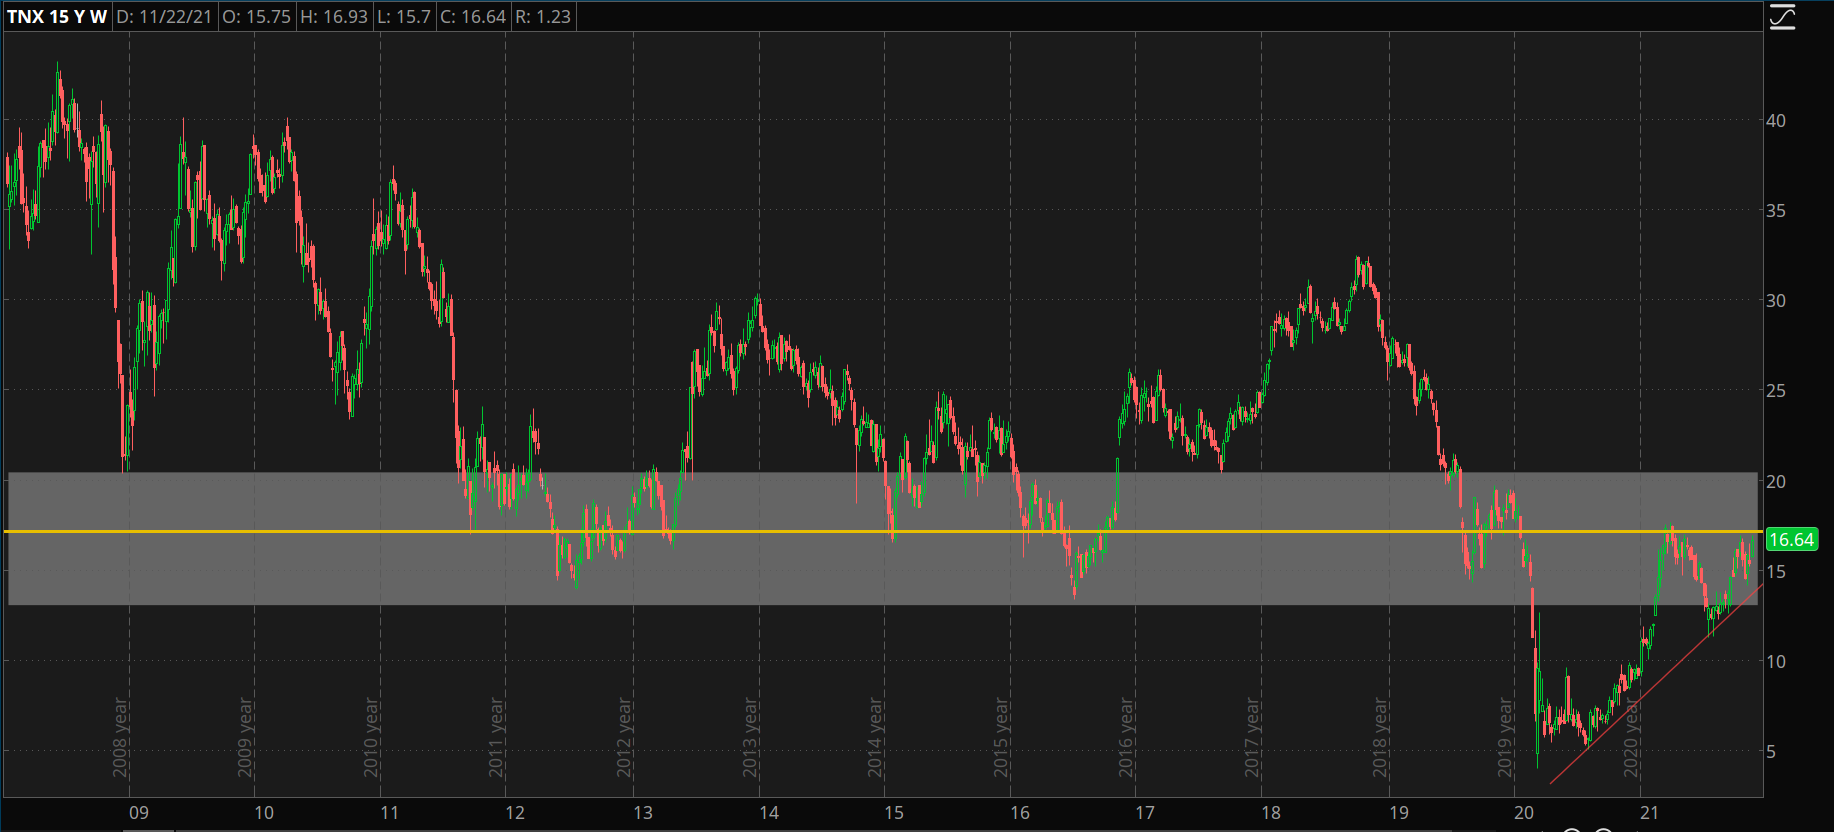
CHART OF THE DAY: COMPOUND INTEREST. The 10-year Treasury Index (TNX—candlesticks) is approaching a long-term resistance level in the middle of an area of congestion that’s been around since 2008. Data Sources: ICE, S&P Dow Jones Indices. Chart source: The thinkorswim® platform. For illustrative purposes only. Past performance does not guarantee future results.
Twos: Earlier in November, Bloomberg reported that the 2-year Treasury futures (/ZT) had become a popular trade for hedge funds speculating on the taper. These investors have been short the “twos” in anticipation of faster tapering plans and an increased likelihood of the Fed raising rates in 2022. The 2-year yield has moved from 0.27% on October 1 to 0.60% on November 23. That’s a change of about 122%. Friday’s move may have scared a few hedge funds out of the twos, but Monday is already seeing a rebound before the open. If hedge funds start to exit the twos, it could be a sign that the rates may start to normalize.
Fed Funds Futures: Fed watchers can see how the futures markets are anticipating potential interest rates changes using the CME FedWatch Tool. It allows users to monitor the probabilities of a Fed interest rate hike.
Looking at the tool’s forecast for June 2022, it’s anticipating the federal funds rate to have a 19.5% chance of being between zero and 25 basis points (bps), which simply means no change, a 45.8% change of being between 25 and 50 bps or one rate hike, a 28.7% chance of being between 50 and 75 bps, which is two rate hikes or a big hike, and a 5.8% of being between 75 and 100 bps. Adding up the projections above 25 bps gives us a reading of an 80.5% chance that at least one rate hike will occur by June 2022. Looking out to December of 2022, it’s currently reading a 98.4% chance of one rate hike and an 88.8% chance of two rate hikes.
While the tools can be helpful, it doesn’t guarantee any rate hikes. The Fed has many members who work to influence rate changes, and 12 of them get to vote on the decision. While the futures market might be part of the decision-making process, it doesn’t make the decisions. As data changes, the probabilities will also change. This is one reason why the tool can be helpful; you can refer to it any time new information occurs to see how the information may influence these decisions.
Twos & Tens: The “2s and 10s” is a ratio that measures the difference between the 2-year Treasury yield and the 10-year Treasury yield. The ratio is often used as an indicator of the steepness of the yield curve despite that there are commonly 12 points on a yield curve from one month to 30 years. Generally speaking, a steeper yield curve is usually considered bullish, and a flat or inverse curve tends to be viewed as bearish.
If the taper continues, watching the 2s and 10s can help investors get an idea of how bond traders are reacting to economic changes. If the 2s and 10s ratio is above zero, it’s considered to be normal. A ratio of zero is flat. A ratio of less than zero is inverse. Today, the ratio is around one, which many would see as a good sign for the economy. The last time it was below zero was August 2019, just before the pandemic’s bear market. In fact, the yield curve has a good track record of warning about recessions, but it’s not a very good timing tool. It can be inverted well before a recession occurs.
These are a few more tools to add to your toolbox of analysis as you build your portfolio.
TD Ameritrade® commentary for educational purposes only. Member SIPC.
The preceding post was written and/or published as a collaboration between Benzinga’s in-house sponsored content team and a financial partner of Benzinga. Although the piece is not and should not be construed as editorial content, the sponsored content team works to ensure that any and all information contained within is true and accurate to the best of their knowledge and research. The content was purely for informational purposes only and not intended to be investing advice.
Image Sourced from Pixabay
© 2024 Benzinga.com. Benzinga does not provide investment advice. All rights reserved.
Trade confidently with insights and alerts from analyst ratings, free reports and breaking news that affects the stocks you care about.

