
Bitcoin BTC/USD was trading slightly lower on Tuesday attempting to break down bearishly from an inside bar pattern the crypto has developed on its daily chart.
A break down from Monday’s mother bar could cause the crypto to decline dramatically because it could also cause a break down from a bear flag pattern.
The bear flag pattern is created with a steep drop lower forming the pole, which is then followed by a consolidation pattern that brings the stock higher between a channel with parallel lines or into a tightening triangle pattern.
- For bullish traders, the "trend is your friend" (until it's not) and the stock or crypto may continue to rise upwards within the following channel for a short period of time. Aggressive traders may decide to purchase the stock or crypto at the lower trendline and exit the trade at the higher trendline.
- Bearish traders will want to watch for a break down from the lower descending trendline of the flag formation, on high volume, for an entry. When a stock or crypto breaks down from a bear flag pattern, the measured move lower is equal to the length of the pole and should be added to the highest price within the flag.
A bear flag is negated when a stock or crypto closes a trading day above the upper trendline of the flag pattern or if the flag rises more than 50% up the length of the pole.
Want direct analysis? Find me in the BZ Pro lounge! Click here for a free trial.
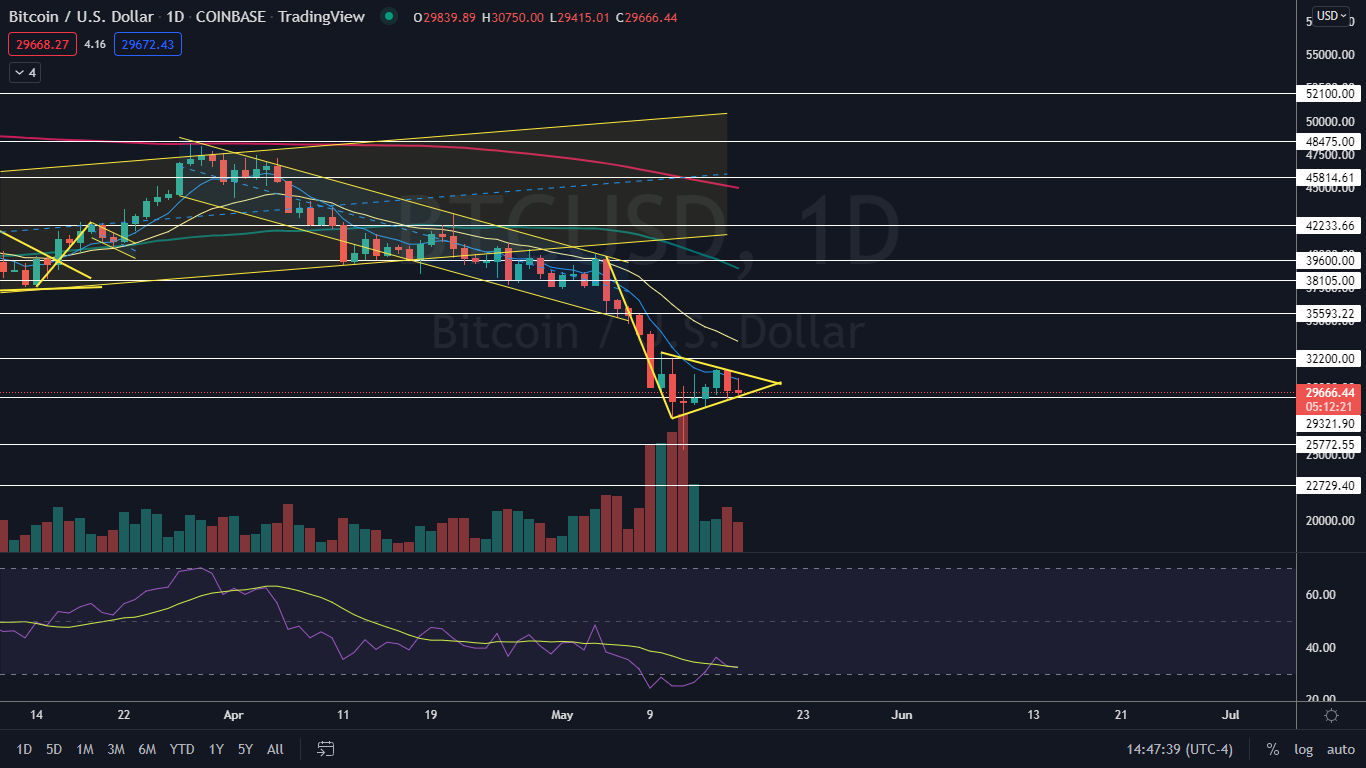
The Bitcoin Chart: Bitcoin’s bear flag pattern was developed between May 5 and Tuesday, with the pole of the formation created during the first 24-hour trading session within the timeframe and the flag developing since then. The measured move, if the pattern is recognized, is about 30%, which suggests Bitcoin could plummet toward the $22,000 mark.
- If the flag pattern is recognized, a potential break down would need to take place on higher-than-average volume in order to confirm the pattern was recognized. Traders and investors should note the crypto could continue to trade within the triangle formation of the flag until reaching the apex on May 21.
- A clear trend isn’t currently visible on Bitcoin’s chart because the crypto has been making a series of lower highs and higher lows. This indicates Bitcoin is currently in a period of consolidation, which is also demonstrated by the crypto's lower-than-average trading volume. At press time, Bitcoin’s volume on Coinbase was measuring in at about 14,690 compared to the 10-day average of 36,333.
- Bitcoin has resistance above at $32,200 and $35,593 and support below at $29,321 and $25,772.
See Also: No, Terra (LUNA) Founder Do Kwon Isn't Offering You Free Bitcoin Or Ethereum
Photo: Mmaxer via Shutterstock
© 2024 Benzinga.com. Benzinga does not provide investment advice. All rights reserved.
Comments
Trade confidently with insights and alerts from analyst ratings, free reports and breaking news that affects the stocks you care about.

