
Ethereum ETH/USD spiked up over 4% higher on Wednesday, in tandem with Bitcoin BTC/USD and the S&P 500, which were rising over 3% and 1.4%, respectively, intraday.
At press time, Ethereum’s 24-hour price action was taking place completely within Tuesday's range, which has is creating an inside bar pattern for the crypto.
An inside bar pattern indicates a period of consolidation and is usually followed by a continuation move in the direction of the current trend.
An inside bar pattern has more validity on larger time frames (four-hour chart or larger). The pattern has a minimum of two candlesticks and consists of a mother bar (the first candlestick in the pattern) followed by one or more subsequent candles. The subsequent candle(s) must be completely inside the range of the mother bar, and each is called an "inside bar."
A double, or triple inside bar can be more powerful than a single inside bar. After the break of an inside bar pattern, traders want to watch for high volume for confirmation the pattern was recognized.
- Bullish traders will want to search for inside bar patterns on stocks that are in an uptrend. Some traders may take a position during the inside bar prior to the break while other aggressive traders will take a position after the break of the pattern.
- For bearish traders, finding an inside bar pattern on a stock that's in a downtrend will be key. Like bullish traders, bears have two options of where to take a position to play the break of the pattern. For bearish traders, the pattern is invalidated if the stock rises above the highest range of the mother candle.
See Also: Will Twitter Add A Dogecoin Tip Jar Anytime Soon?
Want direct analysis? Find me in the BZ Pro lounge! Click here for a free trial.
The Ethereum Chart: Ethereum’s inside bar leans bearish because the crypto was trading lower before forming the pattern. The inside bar is also printing at the bottom range of the mother bar, which adds to the bearish thesis.
- Bullish and bearish traders can watch for a break up or down from the mother bar later on Wednesday or on Thursday to take place on higher-than-average volume to gauge direction and indicate whether the pattern was recognized.
- Ethereum is also trading in a fairly consistent downtrend between two parallel trendlines, which has set the crypto into a falling channel pattern. The pattern is considered to be bearish until a stock or crypto breaks up bullishly from the upper descending trendline of the pattern, which can indicate a large reversal to the upside is in the cards.
- If the crypto breaks down from the mother bar but holds above and prints a reversal candlestick at the lower trendline of the channel, bullish traders may choose to enter into a position for the potential rise back up to the upper trendline. Bearish traders may choose to wait for a rejection at the upper trendline in order to take a short position.
- An upward break from the mother bar would also cause a bullish break up from the channel, leading Ethereum to regain support at the eight-day and 21-day exponential moving averages as well as the 50-day simple moving average, and would give bulls more confidence going forward.
- Ethereum has resistance above at $2,890 and $3,057.82 and support below at $2,609.02 and $2,317.64.
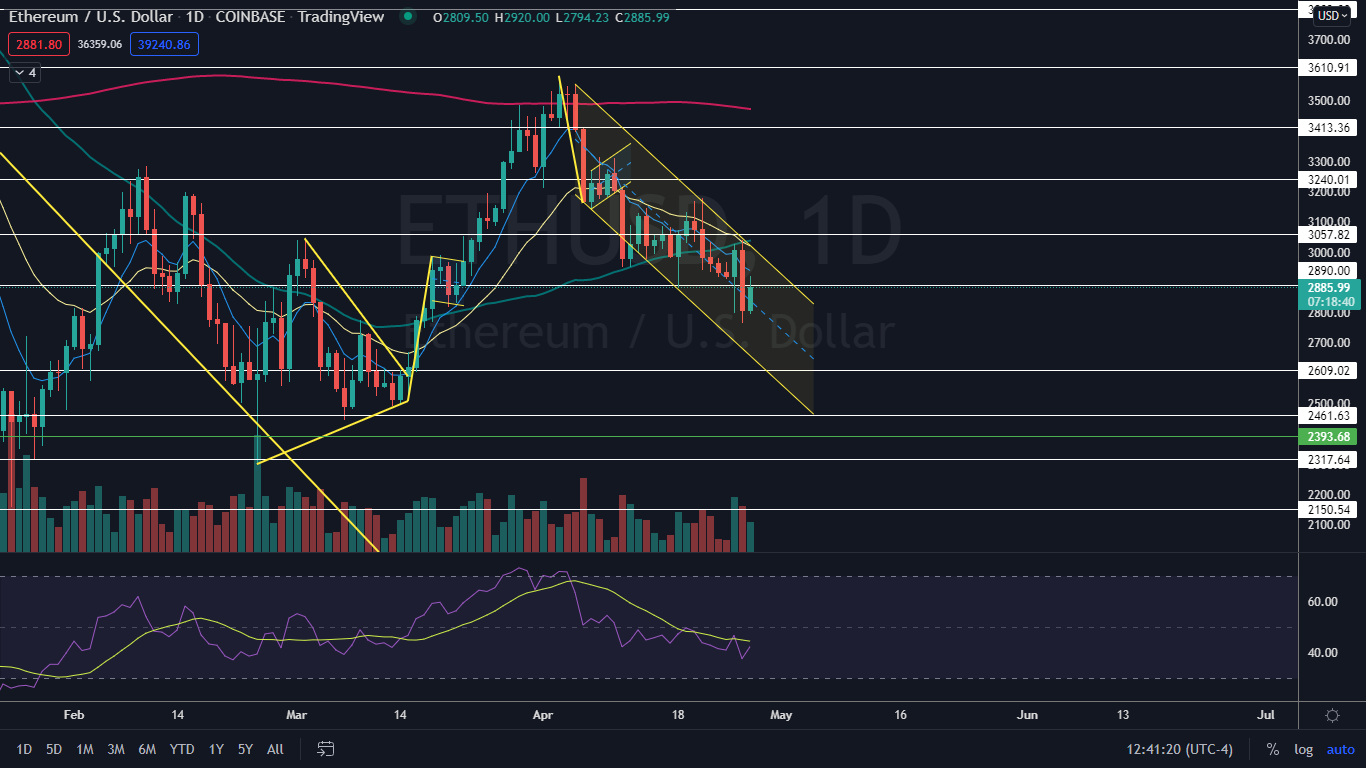
Photo: Courtesy of Ivan Radic on Flickr
© 2024 Benzinga.com. Benzinga does not provide investment advice. All rights reserved.
Comments
Trade confidently with insights and alerts from analyst ratings, free reports and breaking news that affects the stocks you care about.

