The fourteen MSOs in the graph have all worked hard over the last year to lean down their working capital usage in order to increase operating cash flow.

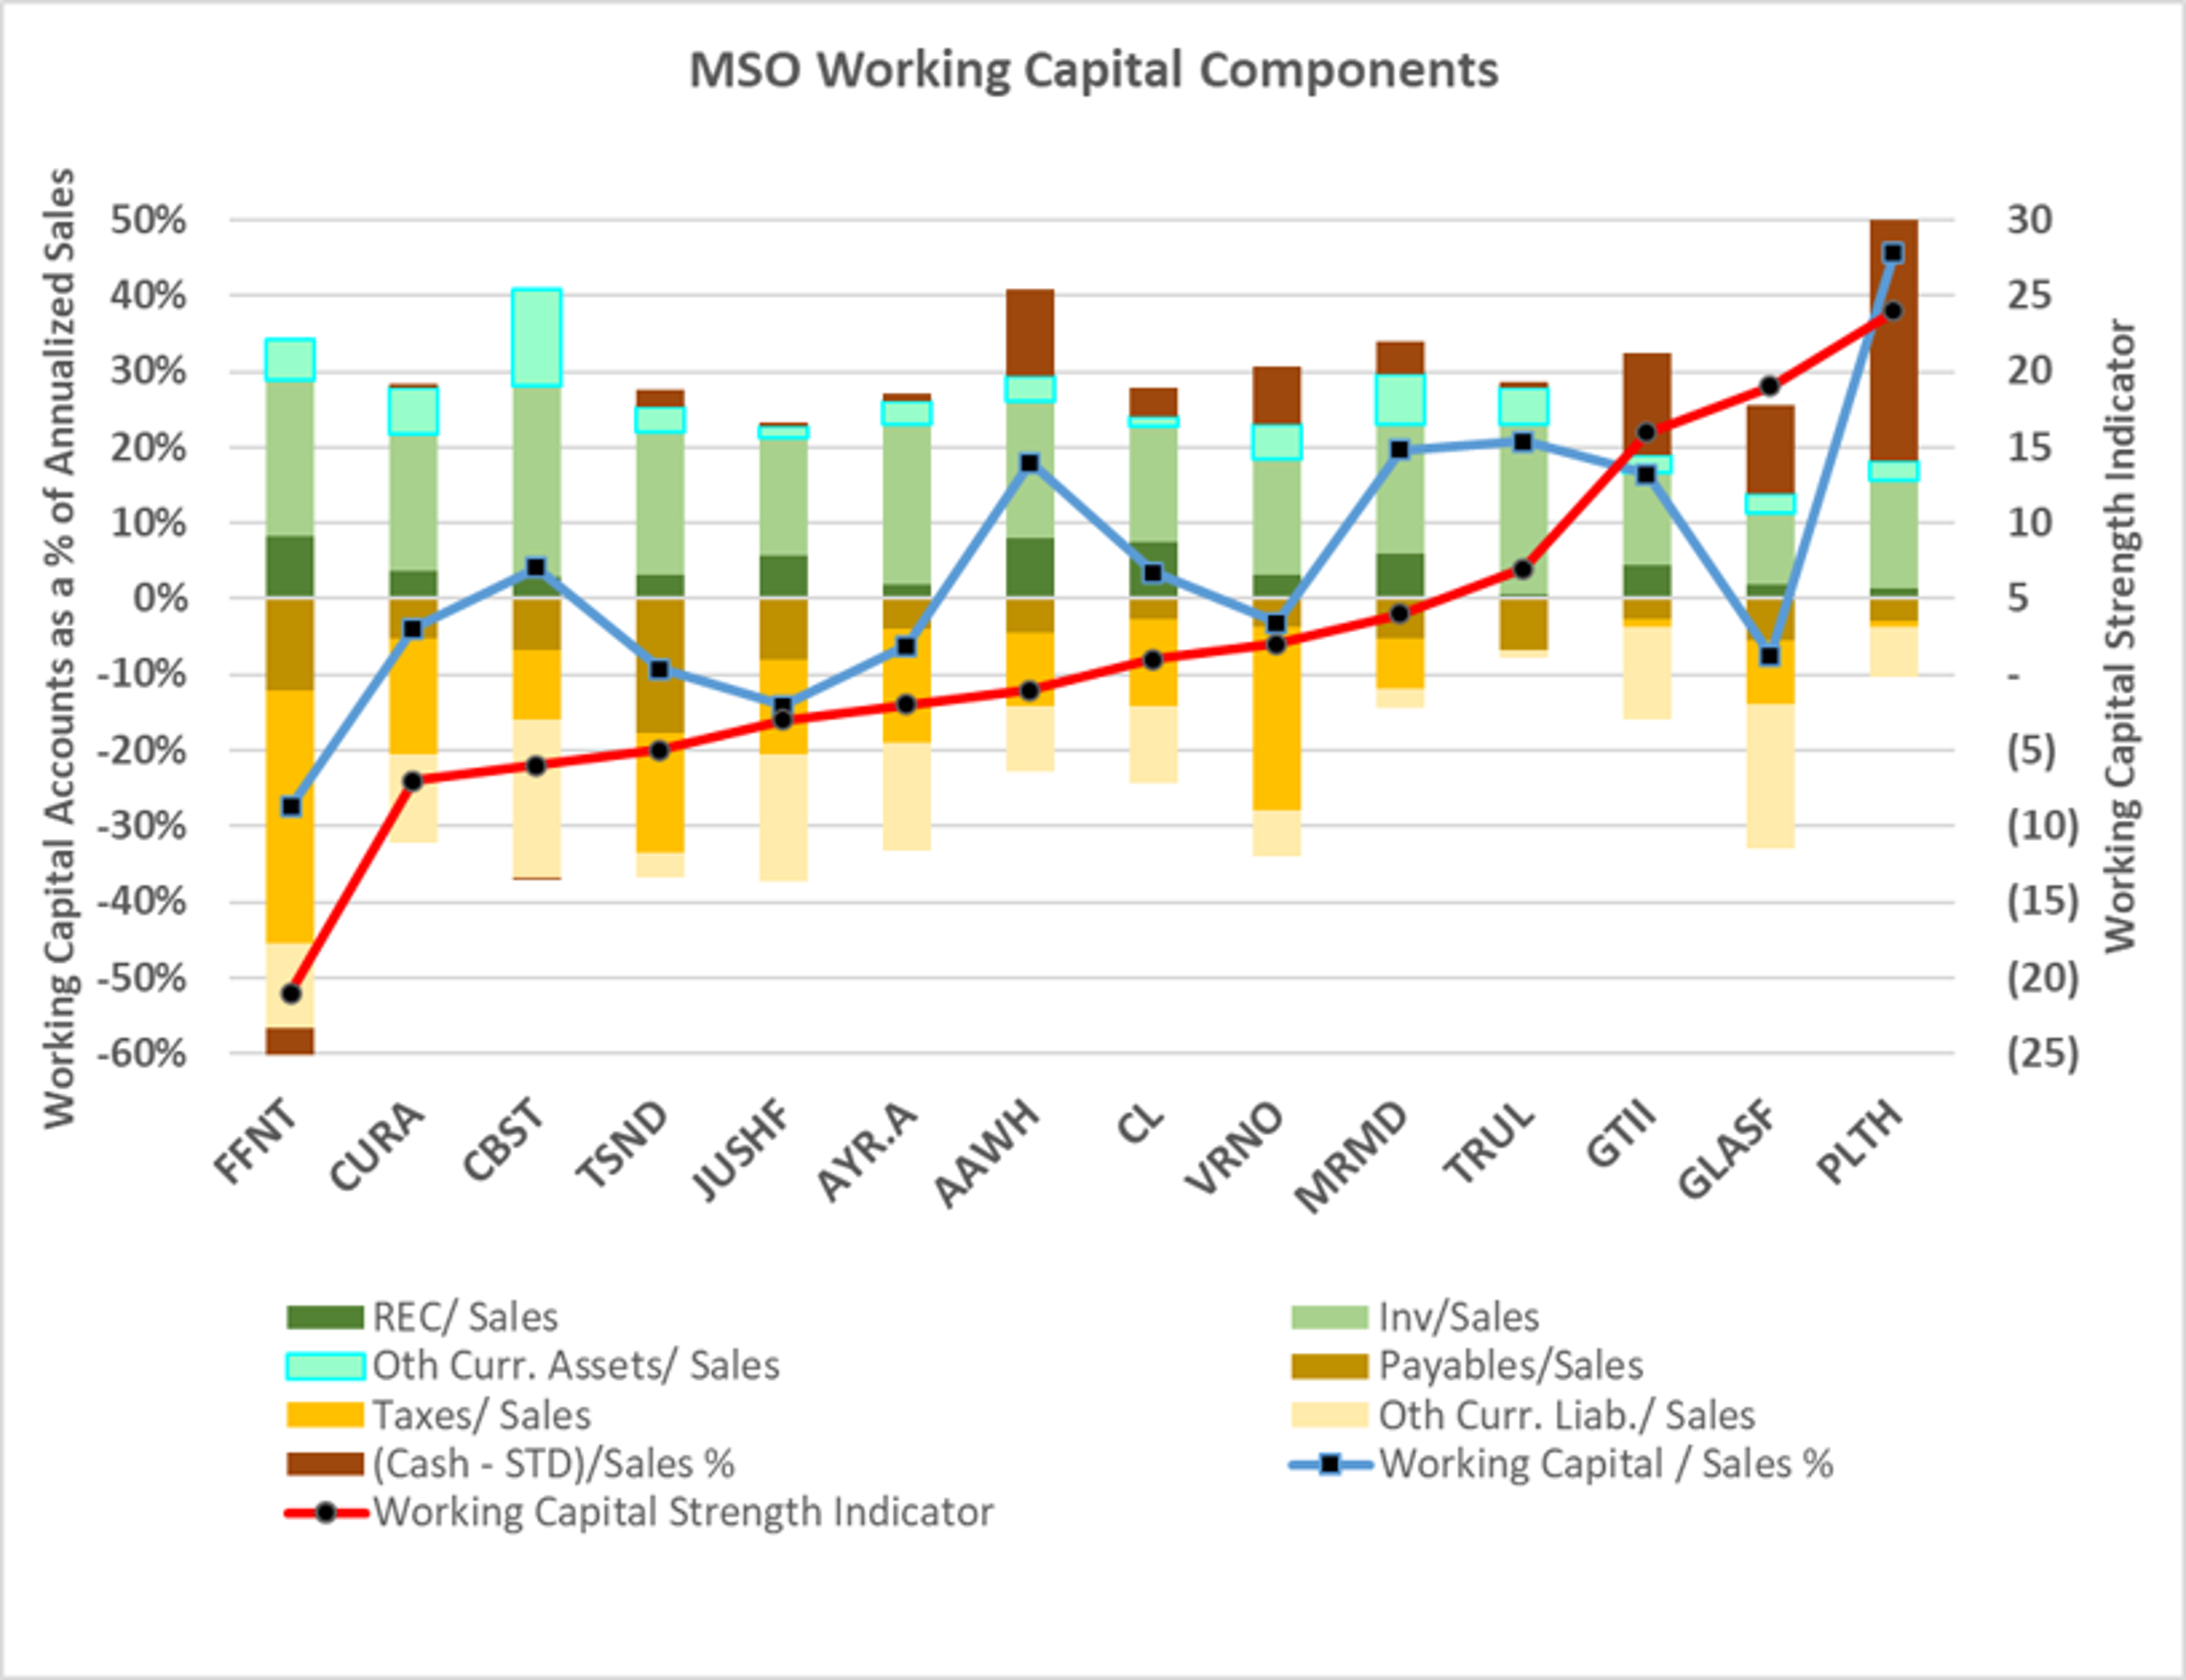
The chart looks at the components of working capital as of June 30, 2023, adjusted for subsequent capital markets transactions. Current assets are broken down into net cash (cash minus short-term debt and current maturities), receivables, inventory, and other current assets. These items are depicted as positive percentages of annualized sales and are measured on the left axis. Current liabilities, shown as negative percentages of annualized sales, are broken into accounts payable, accrued taxes, and other current liabilities.
The blue line depicts working capital as a percentage of sales, ranging from negative 28% for 4Front FFNTF to 46% for Planet 13 PLNH. This ratio, or perhaps the raw dollar equivalent, is the most frequent way to show working capital strength; however, this misses the nuances of the various working capital categories. For example, net cash is preferable to inventories, and accounts payable is preferable to accrued taxes.
Receivables (dark green bars) range from about 0.7% of sales (2.5 days of sales) for Trulieve TCNNF to around 8.3% (30 days) for 4Front. Receivables have become an issue in cannabis due to the relatively low credit quality of the payors.
Inventories, (olive green bars) are still quite high for the group. They range from a low of 67 days of COGS for Glass House GLASF to a high of 183 days for Cannabist (CBST). MSOs have been working to trim inventories at the cost of lower gross margins.
Net cash (cash minus STD) (maroon bars) ranges from negative 5% of sales for 4Front to 38% of sales for Planet 13.
Accrued taxes range from 0% of sales for Trulieve to nearly 34% for 4Front.
Viridian constructed an indicator of working capital strength by ranking the attractiveness of the categories. Net cash is ranked from -6 for the lowest company to 7 for the highest. Receivables, Inventory, and accrued taxes are ranked from -6 for the highest company to 7 for the lowest. The working capital indicator shown in red sums the rankings on each measure and is measured on the right axis.
4Front ranks as having the weakest working capital position. It has negative net cash, the highest receivables, and accrued taxes, and the third-highest days of inventory. Curaleaf CURLF and Cannabist CBSTF both have low net cash and either high accrued taxes (CURA) or high inventory (CBST).
The top three companies, Green Thumb GTBIF, Glass House GLASF, and Planet 13 PLNH, all have strong net cash positions, moderate inventories, and low accrued taxes.
A dollar of working capital is not all the same. It matters what the composition is. And, although working capital is just one aspect of credit quality, investors should pay careful attention to each company’s working capital composition.
The Viridian Capital Chart of the Week highlights key investment, valuation and M&A trends taken from the Viridian Cannabis Deal Tracker.
The Viridian Cannabis Deal Tracker provides the market intelligence that cannabis companies, investors, and acquirers utilize to make informed decisions regarding capital allocation and M&A strategy. The Deal Tracker is a proprietary information service that monitors capital raise and M&A activity in the legal cannabis, CBD, and psychedelics industries. Each week the Tracker aggregates and analyzes all closed deals and segments each according to key metrics:
-
Deals by Industry Sector (To track the flow of capital and M&A Deals by one of 12 Sectors - from Cultivation to Brands to Software)
-
Deal Structure (Equity/Debt for Capital Raises, Cash/Stock/Earnout for M&A) Status of the company announcing the transaction (Public vs. Private)
-
Principals to the Transaction (Issuer/Investor/Lender/Acquirer) Key deal terms (Pricing and Valuation)
-
Key Deal Terms (Deal Size, Valuation, Pricing, Warrants, Cost of Capital)
-
Deals by Location of Issuer/Buyer/Seller (To Track the Flow of Capital and M&A Deals by State and Country)
-
Credit Ratings (Leverage and Liquidity Ratios)
Since its inception in 2015, the Viridian Cannabis Deal Tracker has tracked and analyzed more than 2,500 capital raises and 1,000 M&A transactions totaling over $50 billion in aggregate value.
The preceding article is from one of our external contributors. It does not represent the opinion of Benzinga and has not been edited.
© 2024 Benzinga.com. Benzinga does not provide investment advice. All rights reserved.
Trade confidently with insights and alerts from analyst ratings, free reports and breaking news that affects the stocks you care about.


The Benzinga Cannabis Capital Conference is coming to Florida
The Benzinga Cannabis Capital Conference is returning to Florida, in a new venue in Hollywood, on April 16 and 17, 2024. The two-day event at The Diplomat Beach Resort will be a chance for entrepreneurs, both large and small, to network, learn and grow. Renowned for its trendsetting abilities and influence on the future of cannabis, mark your calendars – this conference is the go-to event of the year for the cannabis world.
Get your tickets now on bzcannabis.com – Prices will increase very soon!