


(Thursday market open) Pressure from crude oil, Treasury yields, and the U.S. dollar continued to ebb early Thursday, but major indexes didn’t see much initial support ahead of tomorrow’s release of critical September Nonfarm Payrolls data.
Another light government report on initial jobless claims this morning appeared to bring pressure heading into the open, as investors grew concerned that Friday’s jobs report could show heavier growth than previously expected.
That report, due out before the opening bell tomorrow, is expected to show jobs growth of 170,000, down from 187,000 in August but above the three-month average. The estimate might rise today as investors digest today’s low Initial Weekly Jobless Claims report of 207,000.
Recent light weekly claims suggest relatively firm September jobs growth, though overall payroll gains have slowed sharply from earlier this year. Today’s weekly claims won’t be calculated into September’s jobs report, but they’re part of a lower trend.
The U.S. 10-year Treasury note yield cooled further early today but remains elevated near 4.72%, down about nine basis points from its recent peak. Crude oil executed a major retreat this week and fell below $83 per barrel overnight after trading near $95 a week ago. It’s now at the lowest point since August 31 as demand concerns weigh. The dollar also gave ground. Any reversal in these lower trends could easily alarm investors, so we’re far from out of the woods. In any case, trading might be subdued today, barring any major news events.
Checking yesterday, major indexes all climbed and volatility eased as falling Treasury yields and lower crude oil prices provided a tailwind. Technology shares were among the strongest performers Wednesday, with the Philadelphia Semiconductor Index (SOX) rising 1.3%. Consumer discretionary stocks were also solid. Energy was the biggest loser as oil and gas producers reflected crude’s nosedive.
Latest Startup Investment Opportunities:


Morning rush
- The 10-year Treasury note yield (TNX) fell one basis point to 4.72%.
- The U.S. Dollar Index ($DXY) was roughly steady near 106.62.
- Cboe Volatility Index® (VIX) futures inched lower to 18.43.
- WTI Crude Oil (/CL) fell 1.6% to $82.91 per barrel, the lowest since late August.
The recent spike in 10-year Treasury note yields to 16-year highs reflects multiple factors: increased supply from the U.S. Treasury; recent hawkish Fed comments and projections; mounting worries that inflation and high interest rates could last well into 2024; and the Federal Reserve’s quantitative tightening (QT) policy.
Just in
Weekly Initial Jobless Claims stayed near 9-month lows at 207,000, up from an upwardly revised 205,000 the prior week. Today’s report was well below the Wall Street consensus of 225,000, according to Briefing.com. The trend in claims over the last month would suggest potential for a higher-than-expected Nonfarm Payrolls headline tomorrow, though today’s number wasn’t included in the government’s calculation for Friday’s report. The so-called “whisper number” for that report is now up to 187,000.
The four-week moving average for initial claims is down from 235,000 in mid-August to 209,000 now. That’s the lowest since February.
In other jobs-related news, Challenger, Gray & Christmas, Inc., reported that U.S.-based employers announced plans to cut 47,457 jobs in September, down from 75,151 in August. The August number was inflated by the bankruptcy of a large trucking firm. The change in job cut announcements has generally trended lower over the past few months, but the level of announcements is moving up.
OPEC still capped: As anticipated, OPEC’s meeting yesterday didn’t result in any changes to the cartel’s commitment to cap production the rest of the year. Crude prices fell anyway, hurt by rising U.S. gasoline stocks.
What to watch
Payrolls positioning: The countdown ticks toward the September Nonfarm Payrolls report, due out Friday at 8:30 a.m. ET. It’s expected to show the following, according to Trading Economics:
- September jobs growth: 170,000, down from 187,000 in August
- September unemployment: 3.7%, down from 3.8% in August
- Monthly hourly wage growth: +0.3%, up from +0.2% in August
- Annual hourly wage growth: +4.3%, even with +4.3% in August
Investors will closely watch wage data for any evidence of firms raising salaries to retain or hire employees—a possible inflationary factor that could worry the Federal Reserve.
Consider any revisions the Fed makes to earlier data. This year’s trend has been downward revisions, and the last three months saw average jobs growth of just 150,000—the lowest post-pandemic amount yet. Any major slices to those months would raise eyebrows about a possible recession. Generally, U.S. economic data have trended less positive lately, though there have been a few high-profile surprises to the upside.
One of those was the August Job Openings and Labor Turnover Survey (JOLTS) earlier this week. However, some analysts splashed cold water on that data Wednesday, noting that the response rate to JOLTS might have been too low to reflect the full picture.
Also, the ADP National Employment Report, which tracks private-sector jobs, showed 89,000 jobs created in September, well below Wall Street’s consensus of 150,000. Again, it’s important to take this with a grain of salt, as it hasn’t aligned closely with the government’s report recently.
Wednesday’s data stayed mixed, with the ADP and the Institute for Supply Management (ISM) Non-Manufacturing index missing expectations. But the ISM reported business activity rising and employment expanding.
“Perhaps most worrisome from an inflation perspective is that prices paid was unchanged at 58.9,” says Kevin Gordon, a senior investment strategist at Schwab, referring to the ISM data (anything over 50 implies expansion). “At some point, if momentum builds to the downside for services, that will look recessionary. We’re not there yet, but it’s worth watching, as it’s in keeping with our rolling recession thesis.”
A rolling recession occurs when different sectors of the economy are slowing at different times, rather than everything slowing at once.
Stocks in spotlight
Conagra CAG shares fell slightly in premarket trading after the packaged goods food company beat earnings per share estimates but came up short of analysts’ revenue expectations for the quarter. The company did reaffirm previous guidance.
The Q3 earnings season begins next week, highlighted by a host of big bank earnings that Friday. Other expected earnings that week include PepsiCo PEP, Walgreens Boots Alliance WBA, Delta Airlines DAL, and Domino’s Pizza DPZ.
Eye on the Fed
Early today, the probability that the Federal Open Market Committee (FOMC) will raise its benchmark funds rate from its current 5.25% to 5.50% target range following its October 31–November 1 meeting was 25%, according to the CME FedWatch Tool. That’s down from near 30% earlier this week. Odds that rates could be a quarter-point higher coming out of the December 12–13 meeting were about 37%.
Talking technicals: The 200-day S&P 500® Index (SPX) moving average near 4,200 might represent technical support. Farther below the market is the 10% correction level of 4,130. See more on the technical picture below.
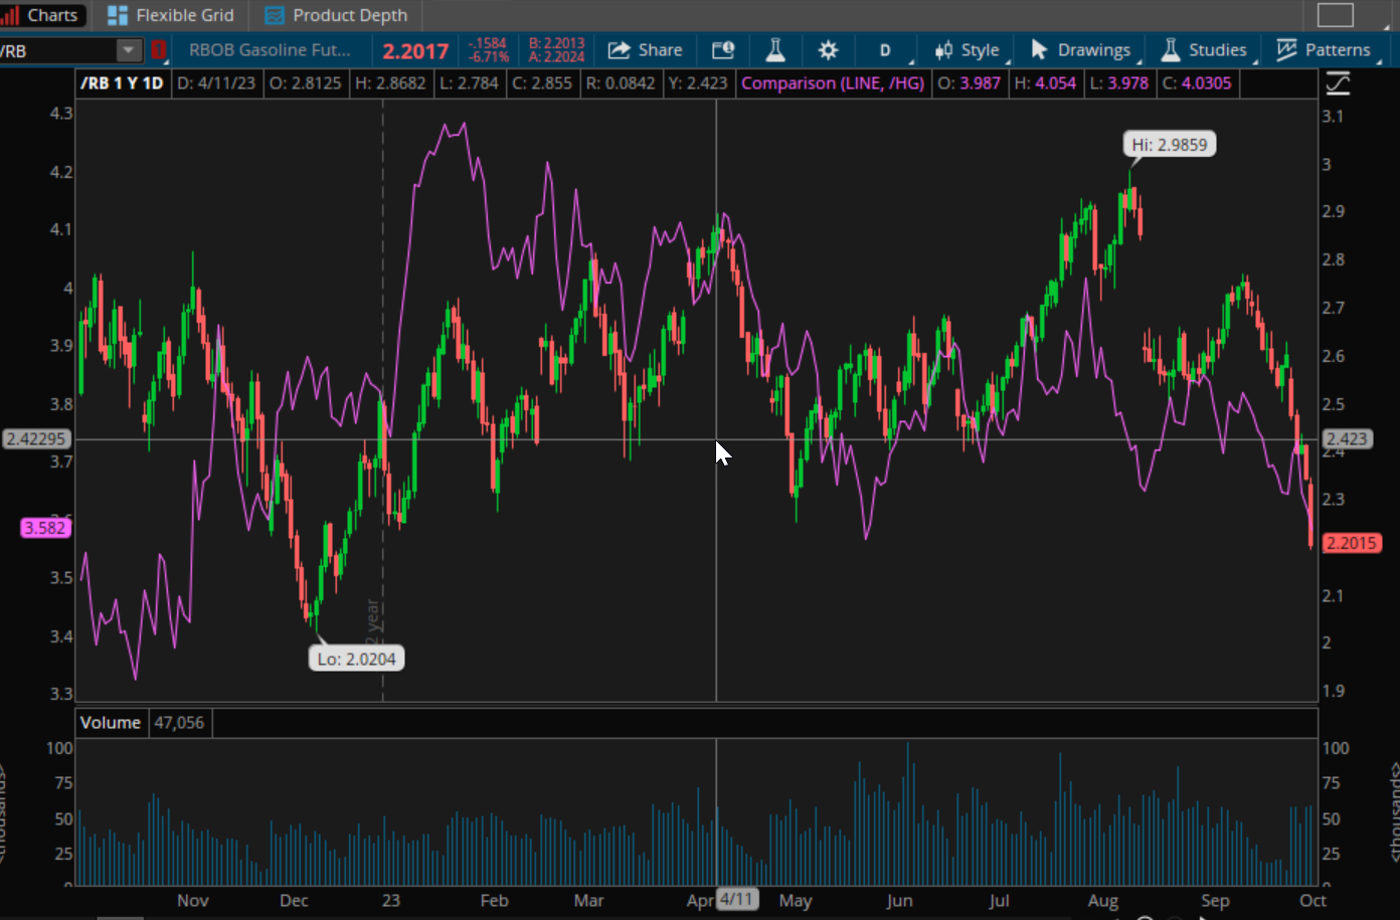
CHART OF THE DAY: CRACK IN COMMODITIES. The prices of both gasoline (/RB-candlesticks) and copper (/HG-purple line) have plunged recently, perhaps a sign of sluggish economic trends as interest rates continue pushing higher. Data source: CME Group. Chart source: The thinkorswim® platform from TD Ameritrade. For illustrative purposes only. Past performance does not guarantee future results.
Thinking cap
Ideas to mull as you trade or invest
Batteries failing? The U.S. economy continues to demonstrate resiliency despite higher yields, which also contributes to yield growth, in a kind of feedback loop. But it’s unclear how long the bunny can keep beating the drum. Some economists note that rising borrowing costs for things like cars, appliances, and homes blunts the positive impact of lower inflation. They can make it feel like life is getting pricier even when price growth has slowed for the traditional basket of goods tracked by the government. Ultimately, this can dent consumer confidence as much as a rising Consumer Price Index (CPI). The economy likely remains in a rolling recession affecting different sectors at different times. The return of college loan payments, high gas prices, the loss of pandemic-era government support mechanisms, the possibility of a government shutdown, dropping mortgage applications, and gradually easing jobs growth might eventually slow the economy down. Underlying weakness in yesterday’s Institute for Supply Management (ISM) Non-Manufacturing data (headline and new orders both fell) could be another indication.
Cash cows: Hoarding cash used to be something companies got punished for by investors, especially when low rates meant those cash piles accumulated little interest. The situation is different now, as one analyst noted on CNBC yesterday, because companies can make 5% on short-term deposits. This means instead of being pressured to use cash to build their business, make acquisitions, or reward investors with higher dividends or buybacks, companies might keep their nest eggs in the bank. Some of the largest firms have double- or even triple-digit billions of cash. For instance, Apple (AAPL) has around $167 billion, which could make the company about $8 billion a year if put in the bank at 5%. That said, $8 billion is arguably a drop in the bucket for Apple, which has a $2.7 trillion market capitalization. Also, its stock performance has been lackluster lately amid falling revenue, so the company could be under pressure to reward investors with cash rather than hoard it. If high rates turn companies against buying back shares or raising dividends, we might find out this earnings season. It’s one of many trends to watch.
100x2: The SPX’s last two penalty box sessions below the 200-day moving average in January and March didn’t last long, and the index built decent positive momentum after both those dips. However, the 200-day’s impact shouldn’t be over-emphasized, as investors found out in 2022 when the market continued selling off multiple times after falling below it. “It’s fair to use the 200-day simple moving average (SMA) as a common technical level that traders look to when we’re going through a correction, and it’s worth noting that there is confluence at the 4,200 level, as this was a prior resistance level for the SPX from February through May this year, so now it’s potential support,” says Nathan Peterson, director of derivatives analysis at the Schwab Center for Financial Research.
Calendar
Oct. 6: September Nonfarm Payrolls.
Oct. 9: No major earnings or data expected.
Oct. 10: August Wholesale Inventories and expected earnings from PepsiCo (PEP).
Oct. 11: September PPI and Core PPI.
Oct. 12: September CPI and Core CPI, and expected earnings from Delta (DAL), Domino’s (DPZ) and Walgreens Boots Alliance (WBA).
The Schwab Center for Financial Research is a division of Charles Schwab & Co., Inc.
Charles Schwab & Co., Inc. (“Schwab”) and TD Ameritrade, Inc., members SIPC are separate but affiliated subsidiaries of The Charles Schwab Corporation. TD Ameritrade is a trademark jointly owned by TD Ameritrade IP Company, Inc. and The Toronto-Dominion Bank.
TD Ameritrade® commentary for educational purposes only. Member SIPC.
Image sourced from Shutterstock
This post contains sponsored content. This content is for informational purposes only and not intended to be investing advice.
Edge Rankings
Price Trend
© 2025 Benzinga.com. Benzinga does not provide investment advice. All rights reserved.
Trade confidently with insights and alerts from analyst ratings, free reports and breaking news that affects the stocks you care about.

