


(Thursday market open) All year Wall Street has struggled to gain traction without “mega-caps” doing the heavy lifting. The theme is unchanged this morning as major indexes lost ground thanks in part to premarket losses in Apple AAPL, Nvidia NVDA, and Tesla (NASDAQ TSLA) amid worries about a more hawkish Federal Reserve and bearish news from China.
Fed fears got recharged following yesterday’s August ISM Non-Manufacturing Index, which showed rising prices and surprisingly strong overall growth. The “good news is bad news” report contributed to the selloff Wednesday, raising inflation concerns. On the plus side, the strong services sector suggests continued U.S. economic resilience.
China also grabbed headlines today as the Wall Street Journal reported Beijing might extend restrictions on iPhone use beyond government offices to offices of various state-owned enterprises. This crackdown in a huge market for Apple, first in the news Wednesday, pushed shares sharply lower yesterday.
Soft Chinese trade data added to a gloomier picture; the country reported an 8.8% drop in exports and a 7.3% drop in imports during August. If the Chinese economy is faltering, it could have an outsized impact on certain U.S. stock sectors with heavier exposure to business there, including tech, materials, and industrials. These sectors are also getting hurt by the strong U.S. dollar, which makes their products more expensive for overseas customers.


Morning rush
- The 10-year Treasury note yield (TNX) eased to 4.27% but remain near 2023 highs.
- The U.S. Dollar Index ($DXY) is steady at 104.95.
- Cboe Volatility Index (VIX) futures ticked up to 14.96.
- WTI Crude Oil (/CL) futures inched lower to $86.93.
Just in
Initial jobless claims sank to 216,000, the government reported Thursday. That’s the lowest reading since late January and good news for workers but may march against the drumbeat about a softening labor market. The more important four-week moving average fell by more than 8,000 to just over 229,000. The data might contribute to the popular mantra of “higher, longer” regarding Fed policy.
Separately, additional government data showed unit labor costs rose and productivity fell in Q2. It looks like instead of laying people off, companies are cutting hours; but that still isn’t helping alleviate the issue of higher and stickier labor costs.
What to watch
Next week brings crucial inflation data including the August Consumer Price Index (CPI), the August Producer Price Index (PPI), and August Retail Sales. Before that, investors will have to make do with smaller scraps including weekly U.S. crude oil inventories later today and Wholesale Inventories tomorrow.
Roll out the barrels: Last week’s crude inventories data showed supplies falling nearly 10 million barrels from the week before, well above the market’s expectations and helping set the stage for crude’s sharp rally this week. Energy shares are currently the one bright spot in the stock market thanks in part to crude’s rally above $87 per barrel. The trend continued Wednesday as the S&P 500 energy sector was the only one to post any gains, and the American Petroleum institute released data yesterday showing another large draw from U.S. oil and gasoline inventories.
Energy shares are up around 14% over the last three months, far outpacing the SPX’s 4% gain over that time. The sector is also closing in on last November’s peak price, raising questions about how much more, well, energy, it might have.
Stocks in Spotlight
Shopping cart: Groceries will be on investors’ plates when Kroger KR reports early Friday. Consensus on Wall Street is for Q2 earnings per share of $0.93 and revenue of $34.13 billion, according to Earnings Whispers. Kroger beat analysts’ expectations last time out, but the stock has been choppy most of the year and trails the SPX year-to-date by a cartload.
Grocery companies are a good barometer of consumer sentiment, especially because they can provide a sense of how much people are willing to pay for name brands. Kroger’s 2,800 supermarkets are well stocked with the company’s own private brands, and customers who feel the pinch of a slowing economy might try to find bargains with these products. On the other hand, Kroger faces tough competition from Walmart WMT, which gained market share in the grocery segment during its most recent quarter.
Also in the checkout line Friday could be an update on Kroger’s proposed $25 billion purchase of Albertsons ACI supermarkets. The two companies are in talks to sell hundreds of stores as part of their merger agreement, Bloomberg reported this week, and a deal could be announced shortly.
Eye on the Fed
As of this morning, the probability that the Federal Open Market Committee (FOMC), the Fed’s policy-setting arm, will maintain current rates after its September 19–20 meeting is 93%, according to the CME FedWatch Tool. The probability that rates will be higher coming out of the November meeting rose to 48%, the FedWatch Tool says, up from 41% a week ago.
The Fed’s Beige Book survey of conditions across the 12 central bank districts released yesterday afternoon had something for everyone but didn’t really lean one way or the other. It spoke of “modest” economic growth, repeating the word it used a lot in its July Beige Book release. Retail spending outside of the tourism industry slowed, and jobs growth was “subdued.”
Talking technicals: Yesterday ended on a somewhat positive note as the S&P 500® Index (SPX) managed to claw back from its session low below the 20-day moving average near 4,445. Still, the SPX finished below its 50-day moving average of 4,473, and the descent of the 20-day below the 50-day this week is a bearish technical indicator that suggests declining momentum.
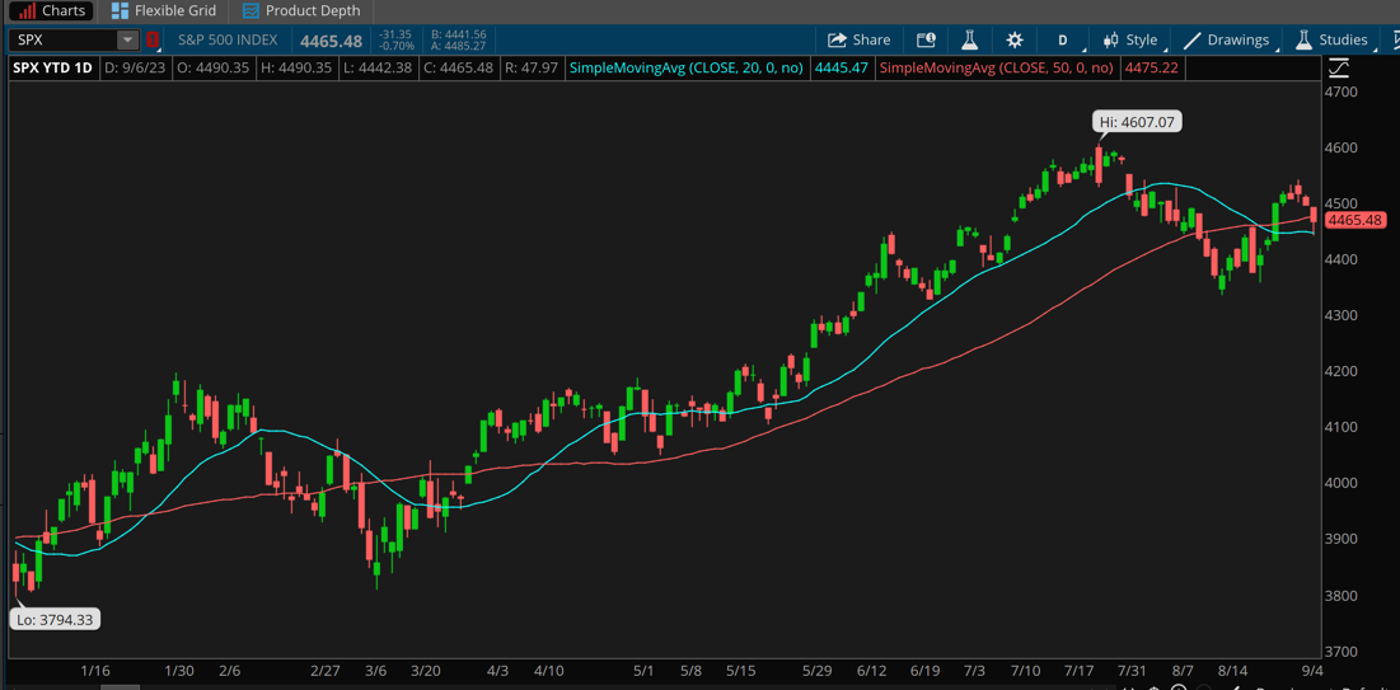
CHART OF THE DAY: CROSSROADS: After several months in which the 20-day moving average (blue line) for the S&P 500 Index (SPX—candlesticks) trended above the 50-day moving average (red line), the 20-day fell below the 50-day this week. This could be a signal of declining positive momentum, though technically the SPX remains in positive territory. Data source: S&P Dow Jones Indices. Chart source: thinkorswim® platform. For illustrative purposes only. Past performance does not guarantee future results.
Thinking cap
Ideas to mull as you trade or invest
How’s my credit? Just over a month from the start of bank earnings, alarm bells aren’t ringing in the corporate debt market. Yield spreads—which track the premium of corporate borrowing costs to U.S. Treasury yields—remained stable recently despite a large and seasonally normal flood of corporate issuance. The average spread for investment-grade debt recently stood at +122 basis points, and the average spread for high-yield debt was +383 basis points. Those numbers were actually a bit narrower than a month ago when they reached +123 and +394, respectively. A narrowing spread generally points toward enthusiasm about economic growth prospects and can support bank shares. Regional bank shares haven’t diverged much from the broader market over the last month or two, a dramatic change from their plunge earlier this year when several small banks failed.
Paint by numbers: Is the economy really growing at a seasonally adjusted rate of 5.6%? That figure, from the Atlanta Fed’s GDPNow tool, shouldn’t cause investors all that much concern about Gross Domestic Product (GDP) becoming overheated. Instead, think of the tool not as a “forecast,” but as a “nowcast.” That means it’s predicated on data that’s already been reported. Analysts have an average Q3 seasonally adjusted GDP growth forecast closer to 2%, which is near the government’s Q2 GDP growth estimate. Looking back at the GDPNow tool versus actual GDP over the last three quarters, the model typically tracked well above the actual government GDP estimate. Even if Q3 GDP does reach a seasonally adjusted 5%, investors should keep things in perspective and not see it as evidence of ignition for the economy. “Almost half of that would reflect a boost in inventories,” says Kevin Gordon, senior investment strategist at Schwab. “And of that inventory growth, all of it is in autos, so to expect that to last in perpetuity is probably unrealistic.”
Earnings recharge: For the first time in two years, analysts lifted their average earnings estimates during the first two months of a quarter, which could bode well for the coming Q3 earnings season. Between June 30 and August 31, the average Wall Street estimate for Q3 S&P 500 earnings growth rose by 0.4%, FactSet says. A few sectors led the Q3 estimate rebound, including consumer discretionary, communication services, and info tech. In addition, eight of 11 sectors saw analysts’ 2023 calendar year estimates improve. This doesn’t mean we’re necessarily in for a rip-roaring earnings season, mainly because corporate revenue growth has slowed to just barely positive. Analysts expect Q3 year-over-year revenue growth of 1.6% and full-year 2023 revenue growth of just 2.4% year over year, according to FactSet. Being unable to raise prices could hurt margins and even force companies to “right-size” their headcount. In other words, look out for layoffs if revenue doesn’t revive.
Calendar
Sept. 8: July Consumer Credit and expected earnings from Kroger (KR).
Sept. 11: Expected earnings from Oracle (ORCL).
Sep. 12: No major earnings or economic data.
Sept. 13: August Consumer Price Index (CPI).
Sept. 14: August Producer Price Index (PPI), August Retail Sales, and expected earnings from Adobe (ADBE) and Lennar (LEN).
TD Ameritrade® commentary for educational purposes only. Member SIPC.
Image sourced from Shutterstock
This post contains sponsored content. This content is for informational purposes only and not intended to be investing advice.
Edge Rankings
Price Trend
© 2025 Benzinga.com. Benzinga does not provide investment advice. All rights reserved.
Trade confidently with insights and alerts from analyst ratings, free reports and breaking news that affects the stocks you care about.

