


Amazon.com, Inc AMZN was trading slightly lower on Monday, in contrast to the S&P 500, which was popping slightly higher ahead of the start of earnings season.
Amazon’s tick downward was taking place on lower-than-average volume, which suggests consolidation as opposed to the bears gaining control. The consolidation was also taking the form of a possible flag formation and, paired with a recent spike higher, may see the stock settle into a bull flag pattern.
The bull flag pattern is created with a stock rising sharply higher to form the pole, which is then followed by a consolidation pattern that brings the stock lower between a channel with parallel lines or into a tightening triangle pattern.
For bearish traders, the "trend is your friend" (until it's not) and the stock may continue downwards within the following channel for a short period of time. Aggressive traders may decide to short the stock at the upper trendline and exit the trade at the lower trendline.
Bullish traders will want to watch for an upward break from the upper descending trendline of the flag formation, on high volume, for an entry. When a stock breaks up from a bull flag pattern, the measured move higher is equal to the length of the pole and should be added to the lowest price within the flag.
A bull flag is negated when a stock closes a trading day below the lower trendline of the flag pattern, or if the flag falls more than 50% down the length of the pole.
If Amazon eventually breaks down from the pattern, volatility in the stock market could increase due to the stock being heavily weighted within the SPDR S&P 500.
Traders wishing to play the potential volatility in the stock market can use MIAX’s SPIKES Volatility products. The products, which are traded on SPIKES Volatility Index SPIKE, track expected volatility in the SPY over the next 30 days.
Want direct analysis? Find me in the BZ Pro lounge! Click here for a free trial.
The Amazon Chart: Amazon’s bull flag pattern was created between July 10 and Monday, with the upward-sloping pole formed between July 10 and Friday and the flag forming since then. The measured move of the pattern is about 8.5%, which suggests Amazon could rise toward the $145 mark in the future.
- Bullish traders want to see the stock break up from the upper descending trend line of the flag on higher-than-average volume, which could indicate the pattern was recognized, and bullish momentum is likely to occur. If that happens, Amazon will also break up from a rising channel pattern on the daily chart, which could indicate a longer-term uptrend is on the horizon.
- Bearish traders want to see big bearish volume come in and drop Amazon under the eight-day exponential moving average, which would negate the bull flag. If that happens, the stock is likely to back-test the lower ascending trend line of the rising channel.
- Amazon has resistance above at $136.83 and $142.18 and support below at $131 and $125.93.

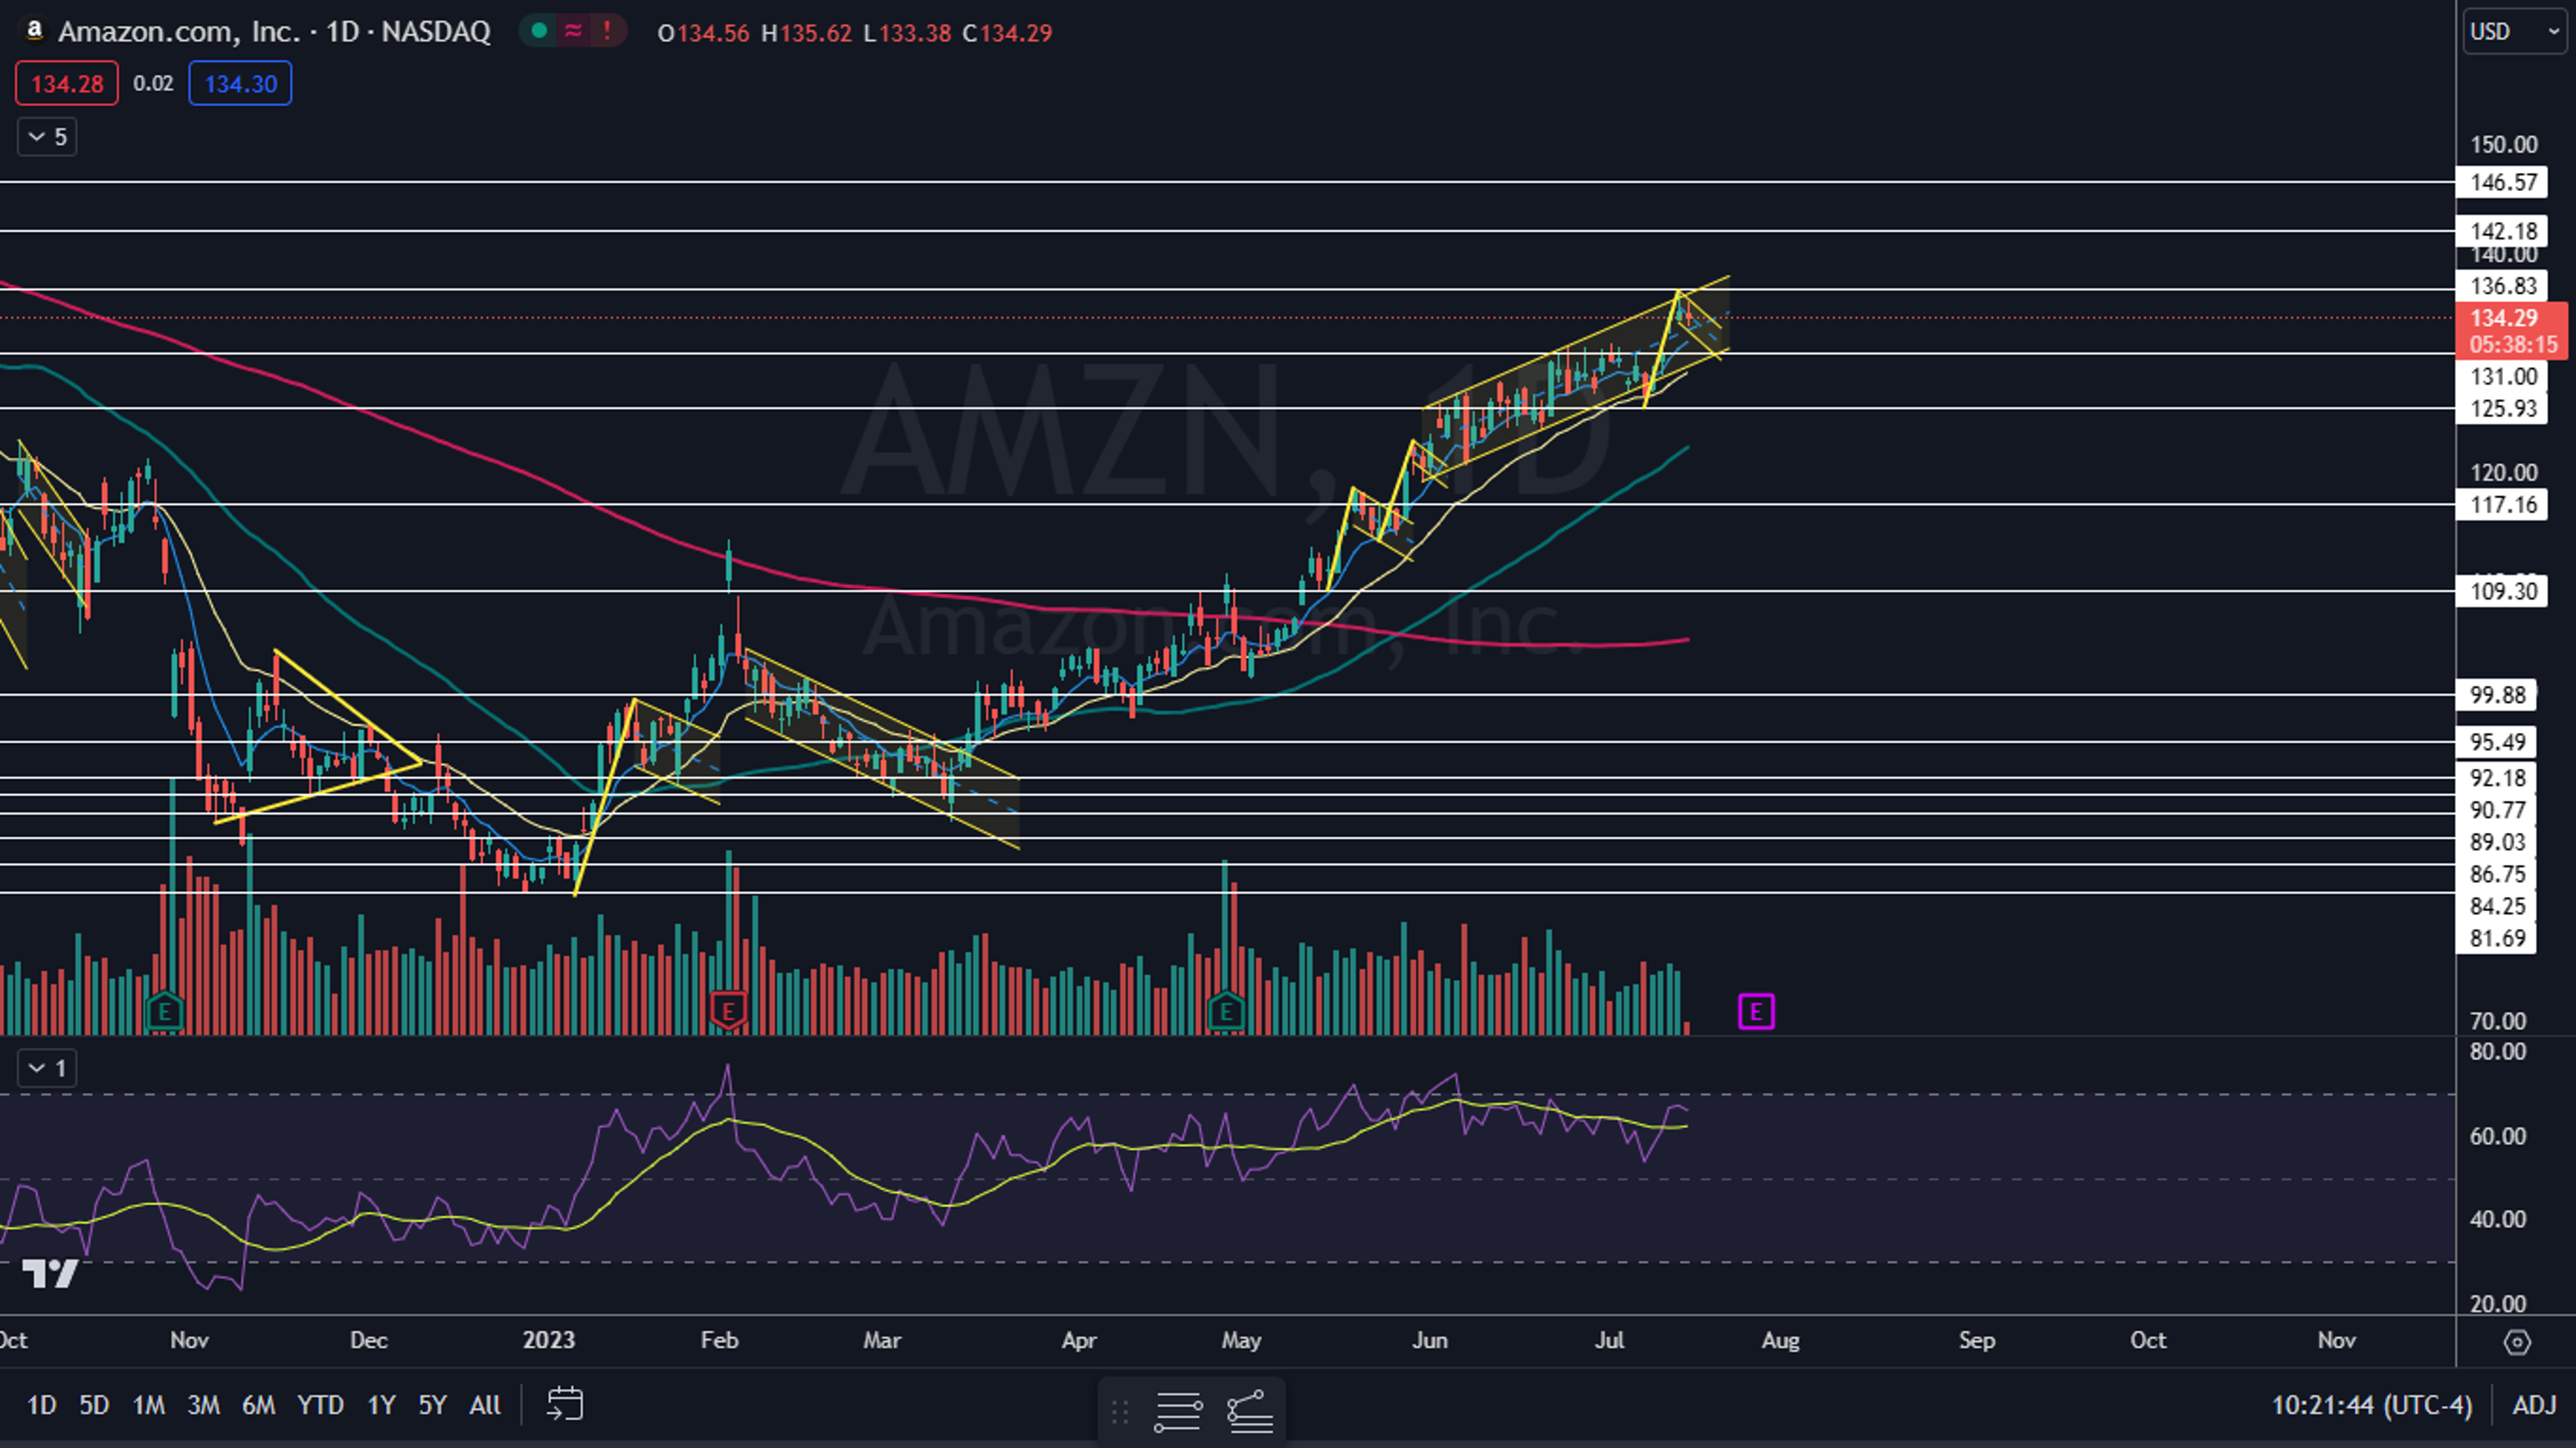
Photo: Shutterstock
© 2024 Benzinga.com. Benzinga does not provide investment advice. All rights reserved.
Trade confidently with insights and alerts from analyst ratings, free reports and breaking news that affects the stocks you care about.

