


Zinger Key Points
- S&P 500 hits new highs at 5,171 points with a 1% increase; poised for 17th week of gains in 19 weeks.
- Sectoral rotation leads the weekly rally so far; materials, utilities, and energy outperform tech sector.
- Historic Summer Setup: 3 "Power Patterns" Triggering in the next 75 Days - Get The Details Now
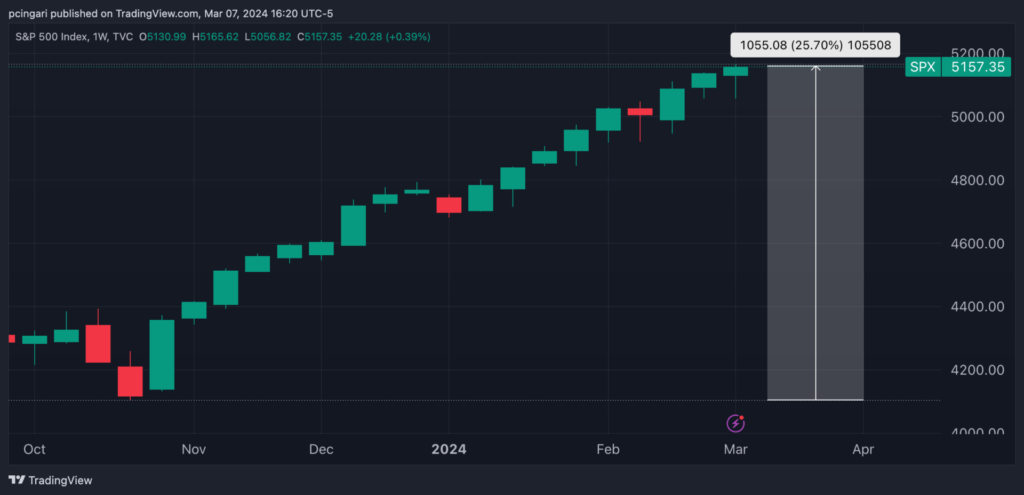
The S&P 500 index concluded Thursday’s session at 5,171, marking a 1% increase and reaching fresh historical highs.
This rally shifted the week’s momentum to positive, potentially marking the 17th gain in the last 19 weeks, unless the index falls by 0.4% on Friday.
Since the end of October, the index, as monitored through the SPDR S&P 500 ETF Trust SPY, has surged over 25%, a testament to the strong trend driving the U.S. equity market.
Currently, the breadth of the market remains healthy with 71% of the S&P 500 stocks trading above their 50-day average, and an even more impressive 74% surpassing the 200-day average. The latter is inching closer to the 75% threshold, a peak not reached since January and the highest since October 2021.
Chart: S&P 500 Breaks All-Time Highs Again

Diverse Sector Performance Defines This Week’s Rally
In a significant departure from previous weeks when the technology sector was predominantly at the forefront of the S&P 500’s advances, this week witnessed a nuanced shift in market leadership.
Sectors that had previously lingered in the background, overshadowed by the tech behemoths, emerged as this week’s frontrunners.
The materials sector led the charge with a 2.8% increase, closely followed by utilities, energy, and consumer staples, showcasing gains of 2.4%, 2%, and 1.73%, respectively. The tech sector, usually the market darling, found itself in the fifth spot, rising by 1.69%.
| Sector | This week’s performance |
|---|---|
| Materials Select Sector SPDR Fund XLB | 2.63% |
| Utilities Select Sector SPDR Fund XLU | 2.38% |
| Energy Select Sector SPDR Fund XLE | 1.96% |
| Consumer Staples Select Sector SPDR Fund XLP | 1.73% |
| Technology Select Sector SPDR Fund XLK | 1.69% |
| Real Estate Select Sector SPDR Fund XLRE | 1.51% |
| Industrials Select Sector SPDR Fund XLI | 1.29% |
| Health Care Select Sector SPDR Fund XLV | 1.28% |
| Financial Select Sector SPDR Fund XLF | 0.47% |
| Communication Services Select Sector SPDR Fund XLC | 0.43% |
| Consumer Discretionary Select Sector SPDR Fund XLY | -1.87% |
Extreme Technical Overbought Signals Emerge
Despite the euphoria surrounding the S&P 500’s record-breaking run, a closer examination of the technical landscape reveals emerging caution signs.
The index’s relentless upward trajectory has catapulted the Relative Strength Index (RSI) to a staggering 77, a figure not seen since January 2020, just before the global markets were roiled by the Covid-19 pandemic.
Such elevated RSI levels are traditionally viewed as overbought signals, suggesting that the current pace of the rally might be stretching the bounds of sustainability.
Chart: S&P 500’s Weekly RSI Reaches Most Overbought Levels In Four Year
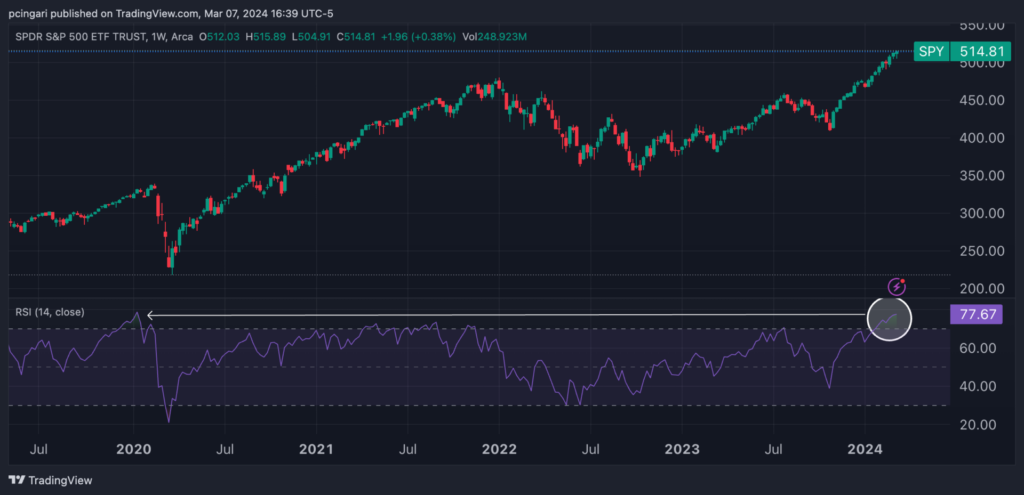
Photo: Shutterstock
Edge Rankings
Price Trend
© 2025 Benzinga.com. Benzinga does not provide investment advice. All rights reserved.
Trade confidently with insights and alerts from analyst ratings, free reports and breaking news that affects the stocks you care about.

