


Stocks made new record highs, with the S&P 500 setting a closing high of 5,175.27 on Tuesday. For the week, the S&P declined 0.1% to close at 5,117.09. The index is now up 7.3% year to date and up 43.1% from its October 12, 2022 closing low of 3,577.03.
One of the more controversial developments in the markets is the persistent rally in stocks as the number of expected Fed rate cuts for 2024 have been falling.
It’s a surprising dynamic because lower rates — all other things being equal — are considered bullish for stocks. And so expectations for fewer rate cuts than previously thought would logically be bearish.
Furthermore, one particularly notable aspect of the recent market rally is that prices are rising faster than expectations for future earnings growth, which means already elevated valuations have been rising. And higher rates are thought to be bad for valuations.
Morgan Stanley’s Michael Wilson recently charted these developments. Valuation is represented by the next-12 month price/earnings (NTM P/E) ratio — it’s the yellow line. The expected change in the Fed’s benchmark interest rate is the blue line. The lines diverged about two months ago.
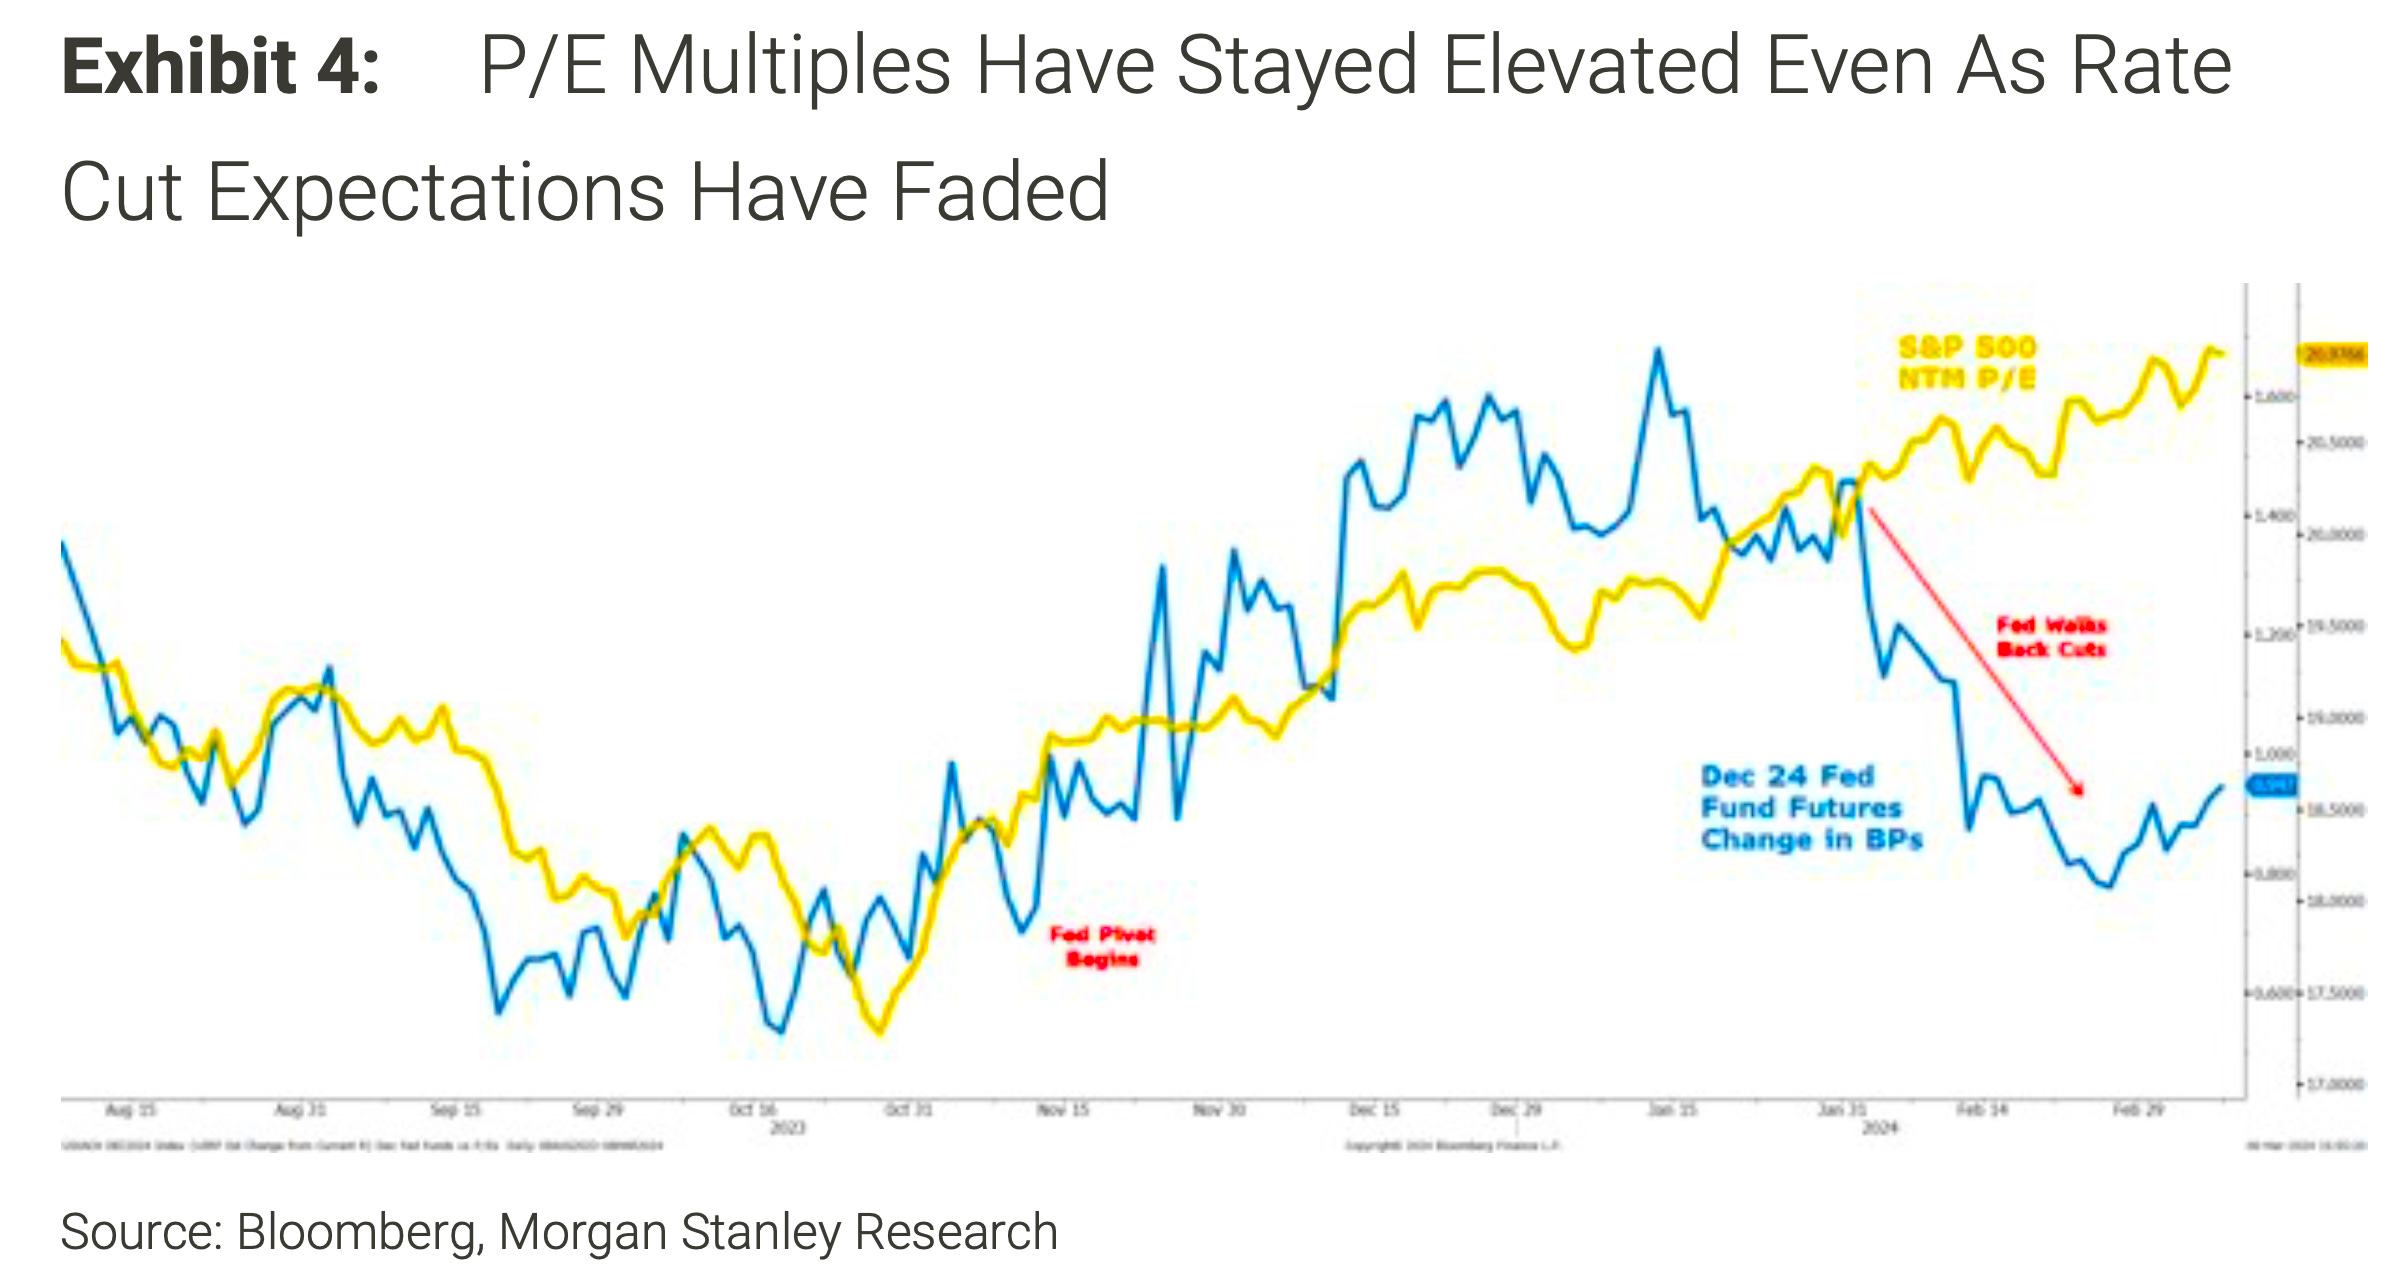
Valuations have been moving higher despite bearish developments on the interest rate front. (Source: Morgan Stanley)
Market skeptics will find this chart frustrating as it’s arguably a manifestation of irrational behavior.
There are at least two big premises to consider to understand the dynamic here.
First, the Fed’s upcoming moves on interest rates might not be that big of a deal for the stock market. During periods of economic and financial stress, Fed rate decisions can be highly impactful. Not so much when the economy is booming and the stock market is at record highs. For more on this argument, read: Whether or not the Fed cuts rates is not the right question 🔪.
Second, valuations aren’t particularly helpful in the short-term. They’re not really mean reverting, and they don’t really tell you what stocks will do in the next 12 months.
In other words, just because valuations are above some long-term average doesn’t mean they’re more likely to fall in the near term. Valuations can become increasingly stretched for reasons that can be hard to explain.
As you can see in the chart below from Yardeni Research, P/E ratios don’t gravitate back to their long term averages quickly. Rather, they often drift away from averages over extended periods that can last years.
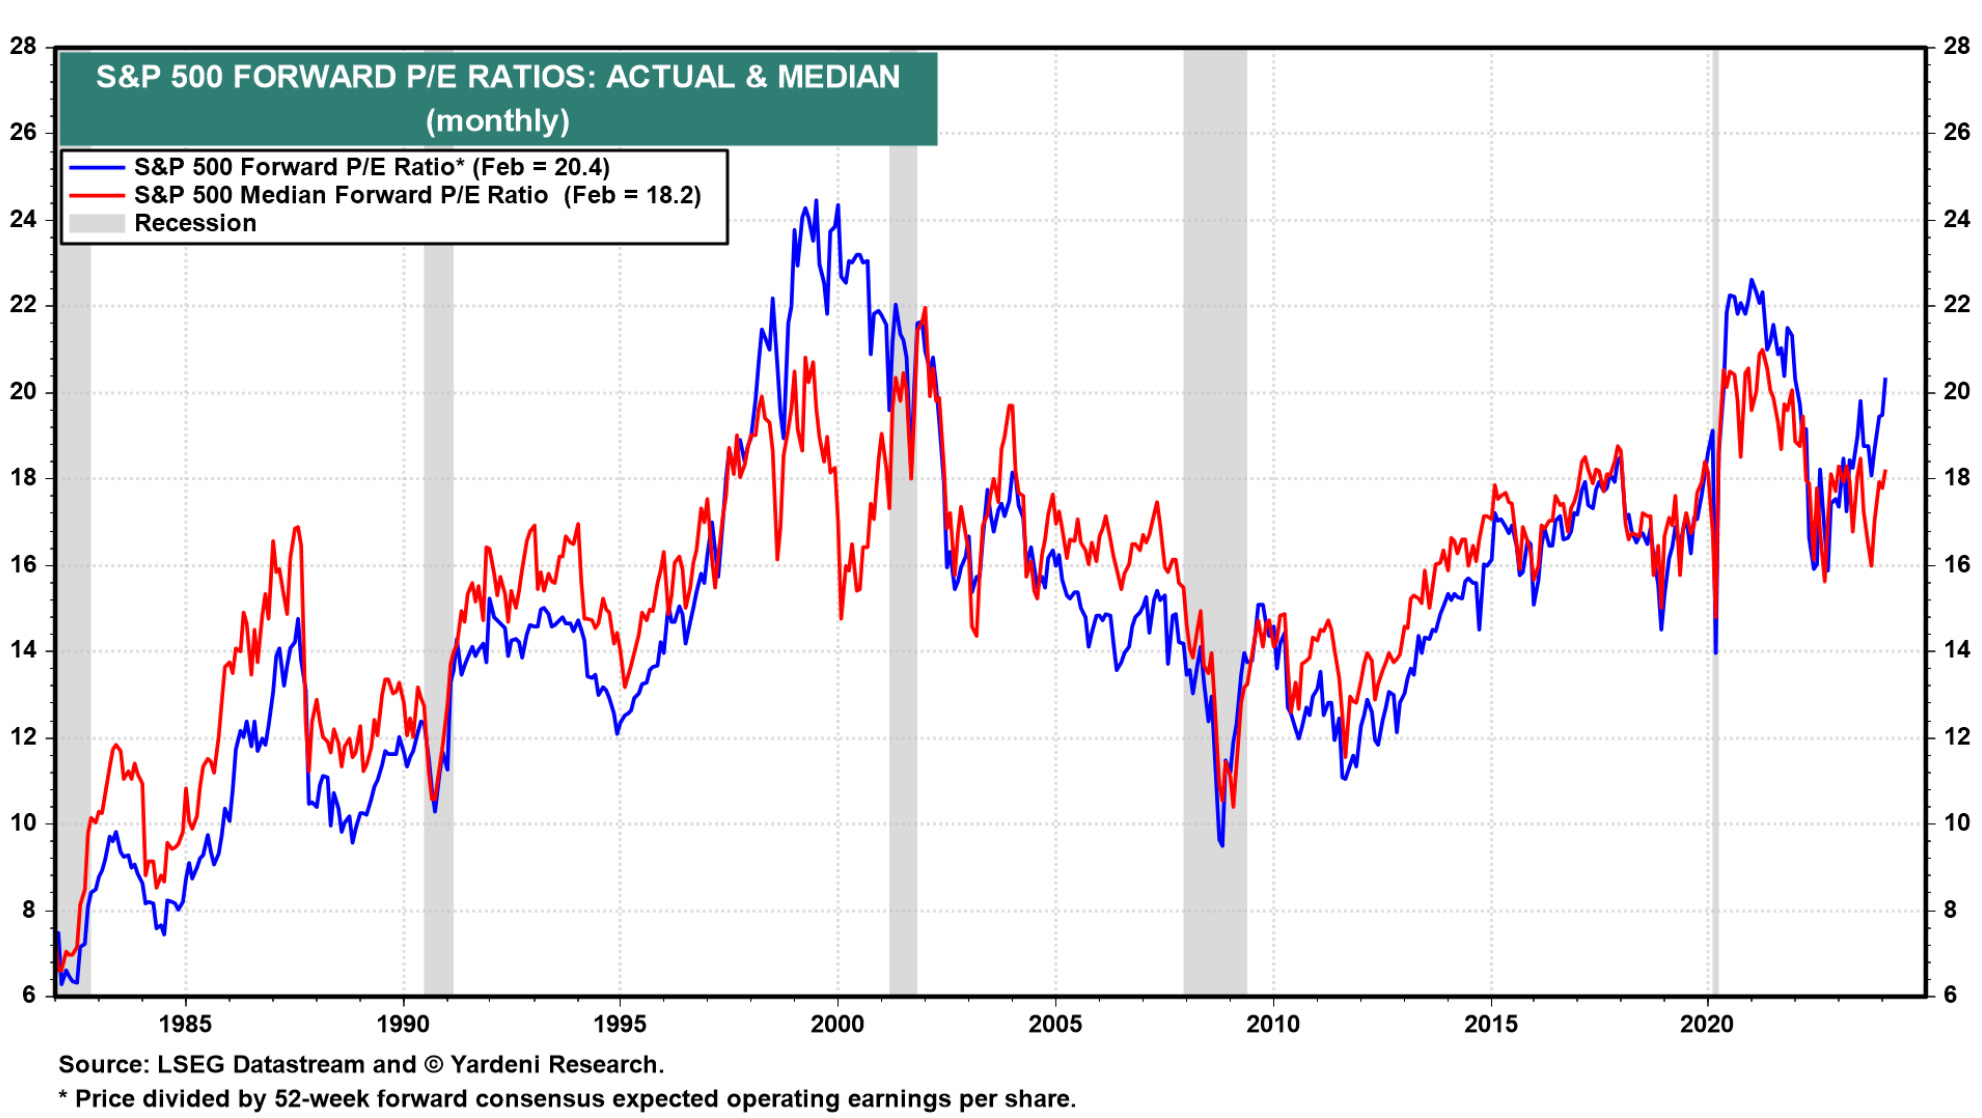
Valuations will drift for extended periods. (Source: Yardeni Research)
Also, elevated valuations today don’t necessarily reflect irrational behavior on the part of investors and traders. Earlier this month, BofA’s Savita Subramanian made the case for why higher valuations today are fundamentally justified. Among other things, she observed that companies are much more efficient than they used to be.
Consider labor productivity for the S&P 500, which is at record highs.

Higher productivity supports the case for higher valuations. (Source: BofA)
Zooming Out
Who knows what’ll happen next? A big correction in the markets would not surprise — in fact, a big intra-year correction in the coming months would be quite typical. A quick sell-off in prices would bring valuations down.
But the point of this discussion is to remind you that valuations aren’t helpful in the short-run, that there’s more to the story than “high interest rates are bad for stocks,” and that what the Fed does next might not be that big of a deal. As such, you should be prepared for the relationship between valuations and Fed decisions to become increasingly loose.
A version of this post was originally published on Tker.co.
© 2024 Benzinga.com. Benzinga does not provide investment advice. All rights reserved.
Trade confidently with insights and alerts from analyst ratings, free reports and breaking news that affects the stocks you care about.

