


The Federal Open Market Committee (FOMC) meeting is the pivotal event for the markets this week, possibly even the most crucial one of the entire first quarter of 2024.
While the customary policy-meeting statement, set to be released at 2 p.m. on Wednesday, is expected to confirm a steady rate stance this month, investors are poised to swiftly redirect their attention to another critical piece of information—the Federal Reserve’s “dot plot,” unveiled alongside the updated Summary of Economic Projections (SEP).
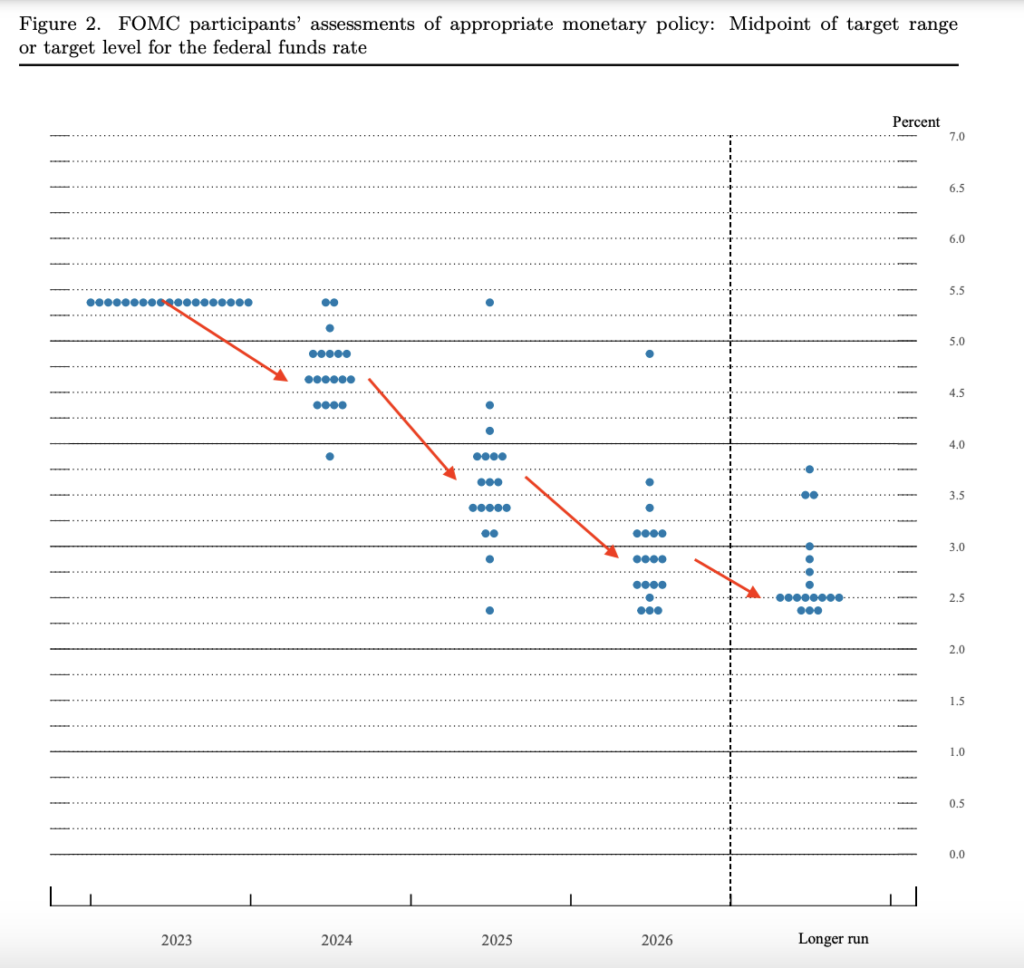
What Is The Fed’s Dot Plot?
Understanding the significance of the Federal Reserve’s dot plot is essential for market participants, as it provides valuable insights into potential future monetary policy decisions.
Picture it like a constellation of dots on a chart, where each dot represents what a Fed policymaker expects interest rates to be in the future. The average, or median, of these dots gives a general idea of where rates might head, but remember, it’s more like a weather forecast than a guarantee—it shows what policymakers are thinking at a specific date, but things can always change.
The dot plot is regularly updated at each quarter-end Federal Reserve meeting, which happens in March, June, September, and December. The Fed’s SEP also includes revisions to economic outlook indicators like growth, unemployment, and inflation rates.
In the December 2023 SEP, the latest Federal Reserve’s dot plot provided a significant hint to markets, indicating the Fed’s readiness to commence interest rate cuts in 2024.
The dot plot showed a projected midpoint in the federal funds rate of 4.6% for 2024, suggesting the potential for three rate cuts from the previous midpoint of 5.4% at the end of 2023.
Looking ahead to 2025, policymakers foresaw a further decline in interest rates, with the median dot suggesting a full percentage point of rate cuts, bringing the projected rate to 3.4%.
This downward trend in interest rates continued into 2026, with an additional three rate cuts expected, culminating in a median dot of 2.9%. As for the long-run, the neutral interest rate, often regarded as a stable benchmark, was anticipated to settle at 2.5%.
Chart: Fed Dot Plot As Of December 2023

Why Is The March Fed’s Dot Plot Crucial For Markets?
There’s a prevailing sentiment among Wall Street economists that the Federal Reserve will maintain the dot plot unchanged at its March 2024 meeting.
Nonetheless, confidence in this expectation is not particularly strong, with many analysts highlighting an increasing risk of the Fed signaling fewer rate cuts in the future.
As of now, markets are pricing in 75 basis points of rate cuts in 2024, which aligns with the indications provided by the December 2023 dot plot.
The critical question revolves around whether the Fed will project two or three rate cuts for the median dot in 2024.
“The potential removal of an expected cut would be taken as hawkish by the market, putting upward pressure on rates and the USD, all else equal,” Bank of America rates analyst Mark Cabana wrote in a recent note.
If this scenario unfolds, we can anticipate that risky assets like stocks may face negative pressure due to the increase in Treasury yields and a stronger dollar, potentially resulting in adverse reactions for key market gauges such as the SPDR S&P 500 ETF Trust SPY and the tech-heavy Invesco QQQ Trust QQQ.
A major gainer would likely be the Invesco DB USD Index Bullish Fund ETF UUP, as it tracks the performance of the greenback.
“Conversely, an unchanged dot amid an upgraded inflation forecast would likely be taken as dovish, as it would reflect less concern over recent inflation stickiness,” Cabana added.
Such a projection would likely be interpreted as confirmation that Fed rate cuts are indeed imminent, easing concerns about potential delays.
This could prompt fresh market speculations regarding the potential for even additional rate cuts in the future, thereby strengthening risk appetite towards stocks and other speculative assets as the Fed gives the green light to monetary policy easing.
Image generated using artificial intelligence with Midjourney.
© 2024 Benzinga.com. Benzinga does not provide investment advice. All rights reserved.
Trade confidently with insights and alerts from analyst ratings, free reports and breaking news that affects the stocks you care about.

