


Zinger Key Points
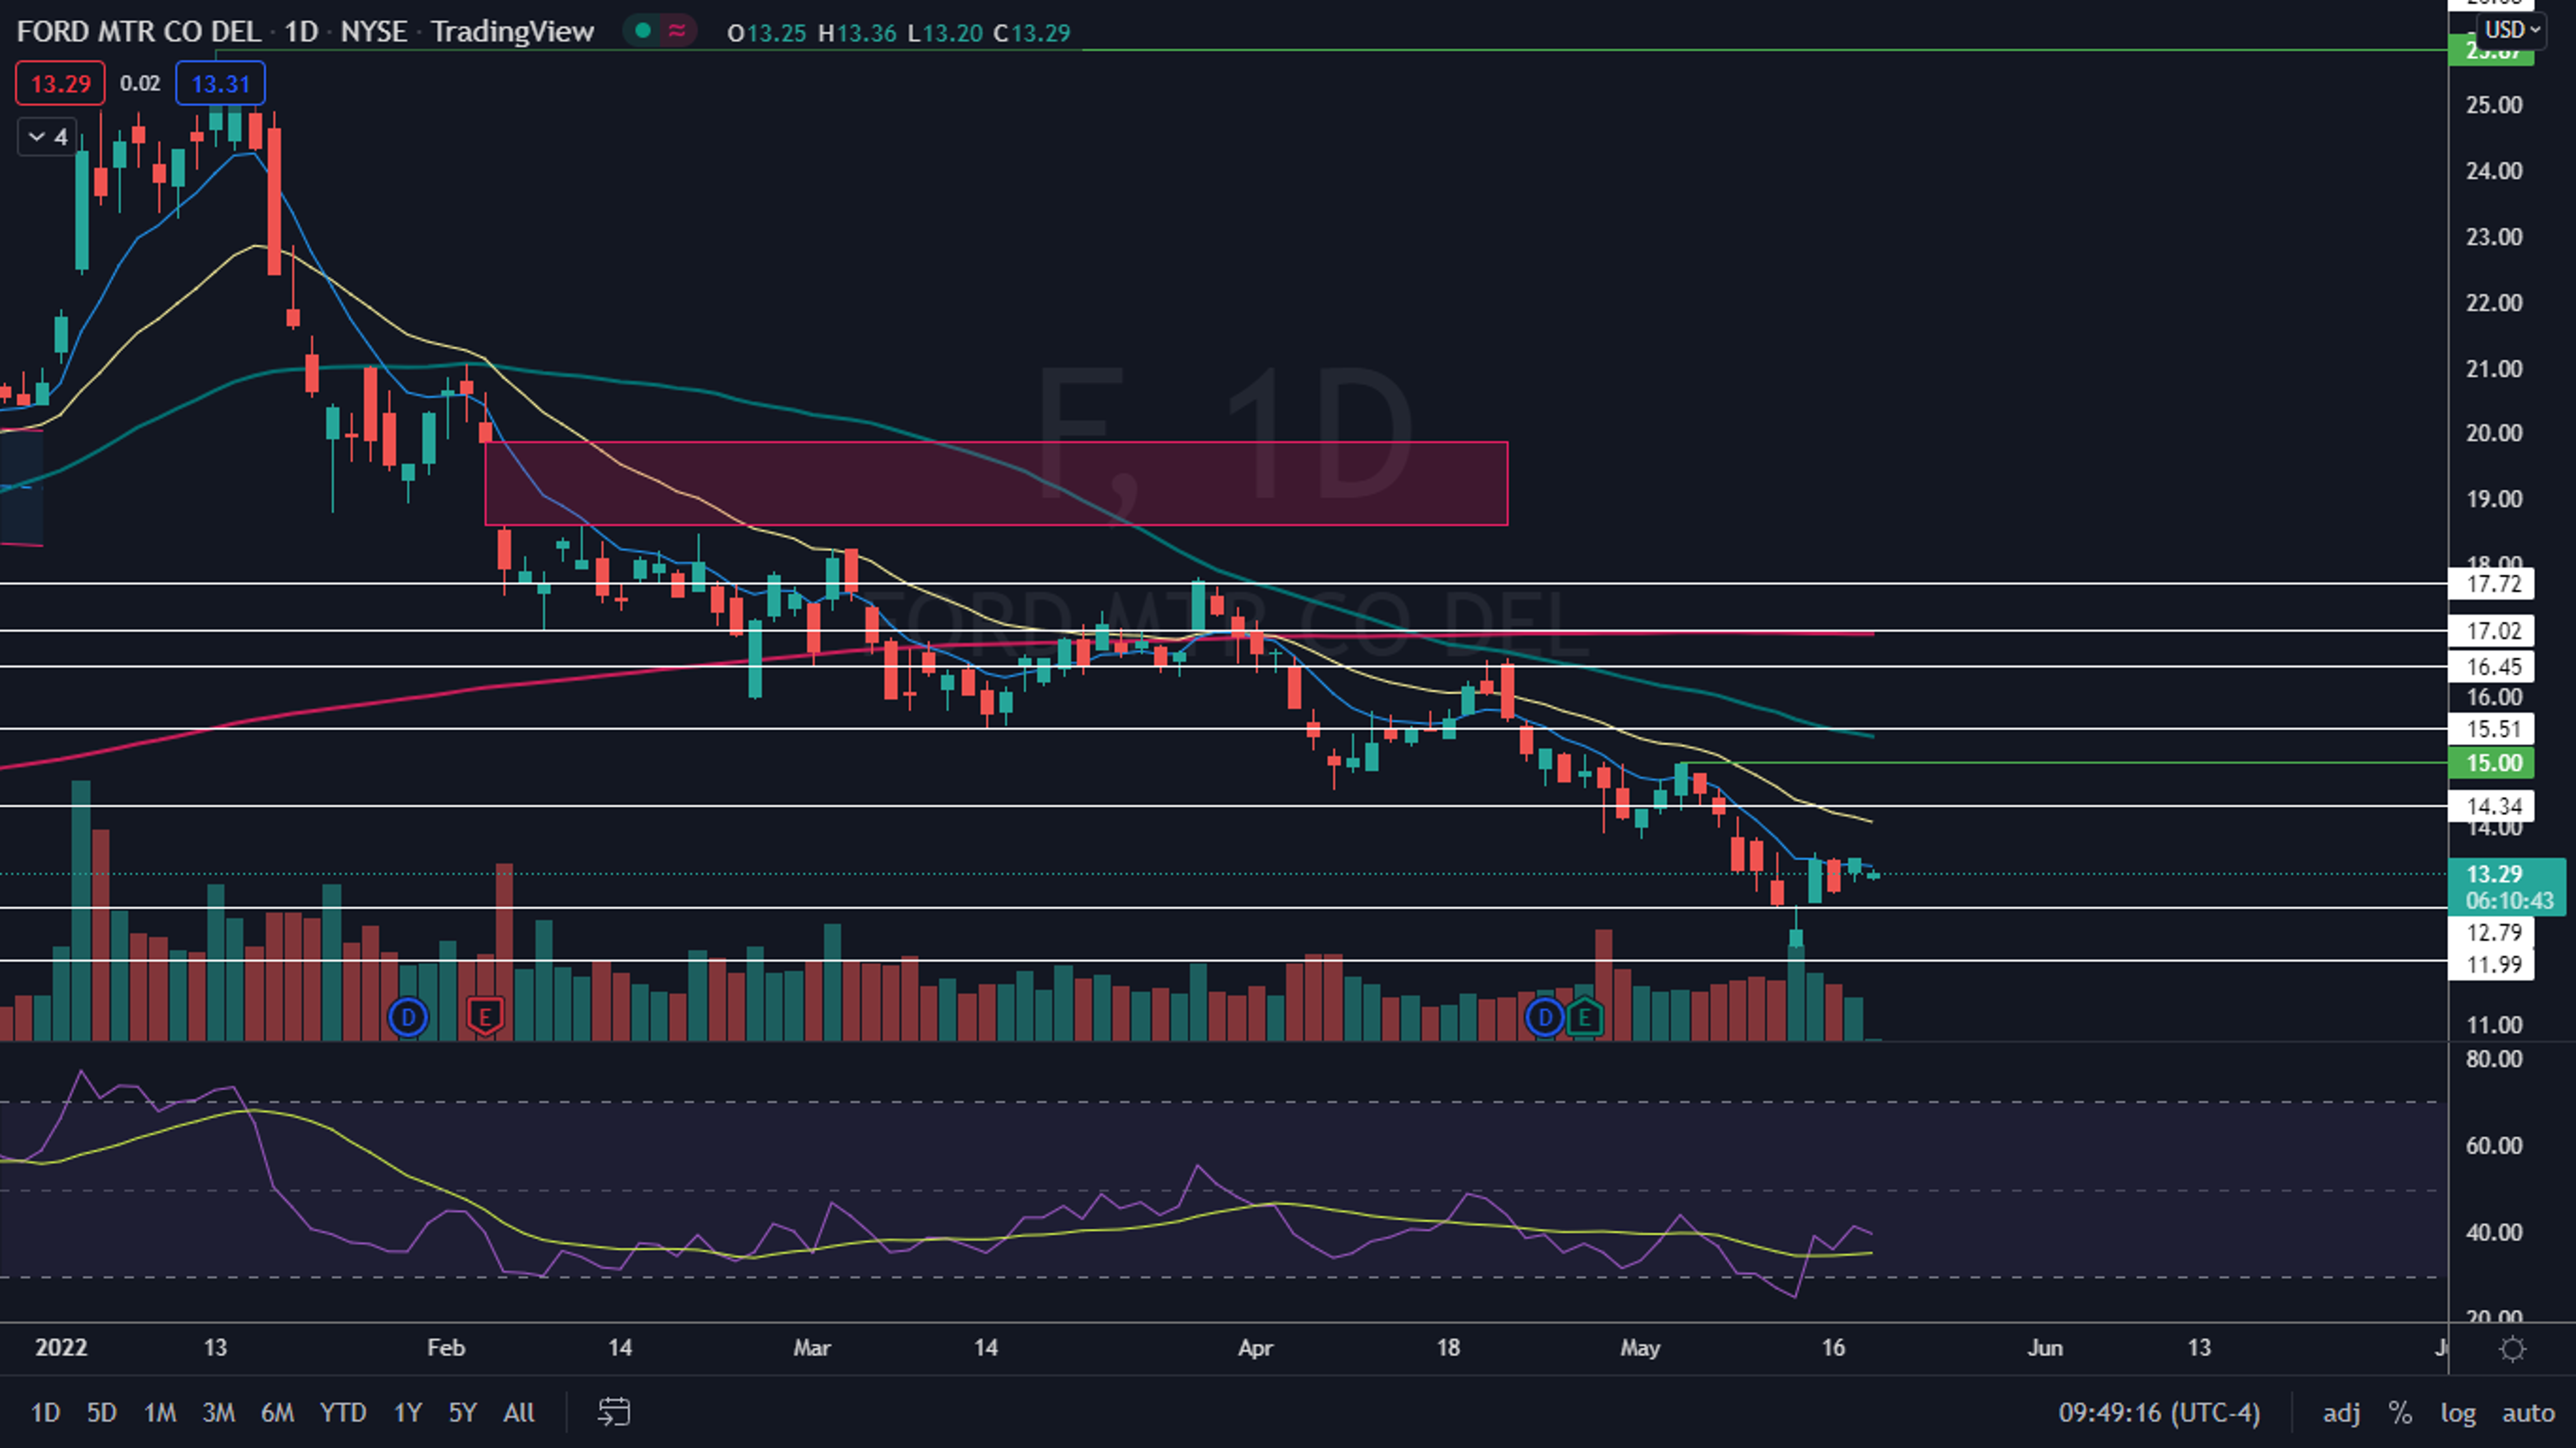
- Ford has resistance above at $14.34 and $15.51 and support below at $12.79 and $11.99.
- Ford has a 52-week high of $25.87 and a 52-week low of $11.79.
- Get access to the leaderboards pointing to tomorrow’s biggest stock movers.
Ford Motor Company F opened lower on Wednesday in sympathy with the general market, which saw the S&P 500 trading over 1% lower.
The legacy automaker-turning-electric vehicle giant, which plans to take on Tesla, Inc TSLA in a battle for market share, has recently been flashing bullish indicators on its chart.
For now, the bounce to the upside is merely part of an overall downtrend, but Ford looks set to trade higher in the immediate future because the stock has developed a quadruple inside bar pattern.
An inside bar pattern indicates a period of consolidation and is usually followed by a continuation move in the direction of the current trend.
An inside bar pattern has more validity on longer time frames (four-hour charts or longer). The pattern has a minimum of two candlesticks and consists of a mother bar (the first candlestick in the pattern) followed by one or more subsequent candles. The subsequent candle(s) must be completely inside the range of the mother bar and each is called an "inside bar."
A double or triple inside bar can be more powerful than a single inside bar. After the break of an inside bar pattern, traders want to watch for high volume for confirmation the pattern was recognized.
- Bullish traders will want to search for inside bar patterns on stocks that are in an uptrend. Some traders may take a position during the inside bar prior to the break, while other aggressive traders will take a position after the break of the pattern.
- For bearish traders, finding an inside bar pattern on a stock that's in a downtrend will be key. Like bullish traders, bears have two options of where to take a position to play the break of the pattern. For bearish traders, the pattern is invalidated if the stock rises above the highest range of the mother candle.
Want direct analysis? Find me in the BZ Pro lounge! Click here for a free trial.
The Ford Chart: This week, Ford’s trading range has taken place completely within Friday’s price range, which has set up the quadruple bar pattern. The inside bars lean bullish in this case because Ford was trading higher before settling into the pattern, but traders and investors can watch for a break up or down from Friday’s mother bar on higher-than-average volume to gauge future direction.
- If Ford breaks down from Friday’s low-of-day at the $12.87 mark, the most recent lower high that was printed on that day at $13.63 will mark the temporary top and the stock is likely to continue in its downtrend.
- If Ford breaks up above Friday’s high-of-day, it will signal the temporary top hasn’t printed, although an uptrend can’t be confirmed until the stock prints a higher low above the most recent lower low at $12.21.
- Ford has a gap above between $18.59 and $19.87. Gaps on charts fill about 90% of the time, which suggests Ford will eventually trade up to fill the empty range. If Ford were to rise up and fill that gap, it would represent a 48% increase from the current share price.
- Ford has resistance above at $14.34 and $15.51 and support below at $12.79 and $11.99.

See Also: The Final Call: Time To Buy These Undervalued Stocks
Photo courtesy of Ford.
Edge Rankings
Price Trend
© 2025 Benzinga.com. Benzinga does not provide investment advice. All rights reserved.
Trade confidently with insights and alerts from analyst ratings, free reports and breaking news that affects the stocks you care about.

