
GameStop Corporation GME was falling more than 6% at one point on Monday compared to the general market, which saw the S&P 500 trading mostly flat.
The stock has been in a heavy downtrend, losing 61% between March 29 and May 12 and on Monday, GameStop appeared it may be heading for its next lower low within the pattern.
A downtrend occurs when a stock consistently makes a series of lower lows and lower highs on the chart.
The lower lows indicate the bears are in control while the intermittent lower highs indicate consolidation periods.
Traders can use moving averages to help identify an uptrend with descending lower timeframe moving averages (such as the eight-day or 21-day exponential moving averages) indicating the stock is in a steep shorter-term downtrend and descending longer-term moving averages (such as the 200-day simple moving average) indicating a long-term downtrend.
A stock often signals when the lower low is in by printing a reversal candlestick such as a doji, bullish engulfing or hammer candlestick. Likewise, the lower high could be signaled when a doji, gravestone or dragonfly candlestick is printed. Moreover, the lower lows and lower highs often take place at resistance and support levels.
In a downtrend the "trend is your friend" until it’s not and in a downtrend, there are ways for both bullish and bearish traders to participate in the stock:
- Bearish traders who are already holding a position in a stock can feel confident the downtrend will continue unless the stock makes a higher high. Traders looking to take a position in a stock trading in a downtrend can usually find the safest entry on the lower high.
- Bullish traders can enter the trade on the lower low and exit on the lower high. These traders can also enter when the downtrend breaks and the stock makes a higher high indicating a reversal into an uptrend may be in the cards.
Want direct analysis? Find me in the BZ Pro lounge! Click here for a free trial.
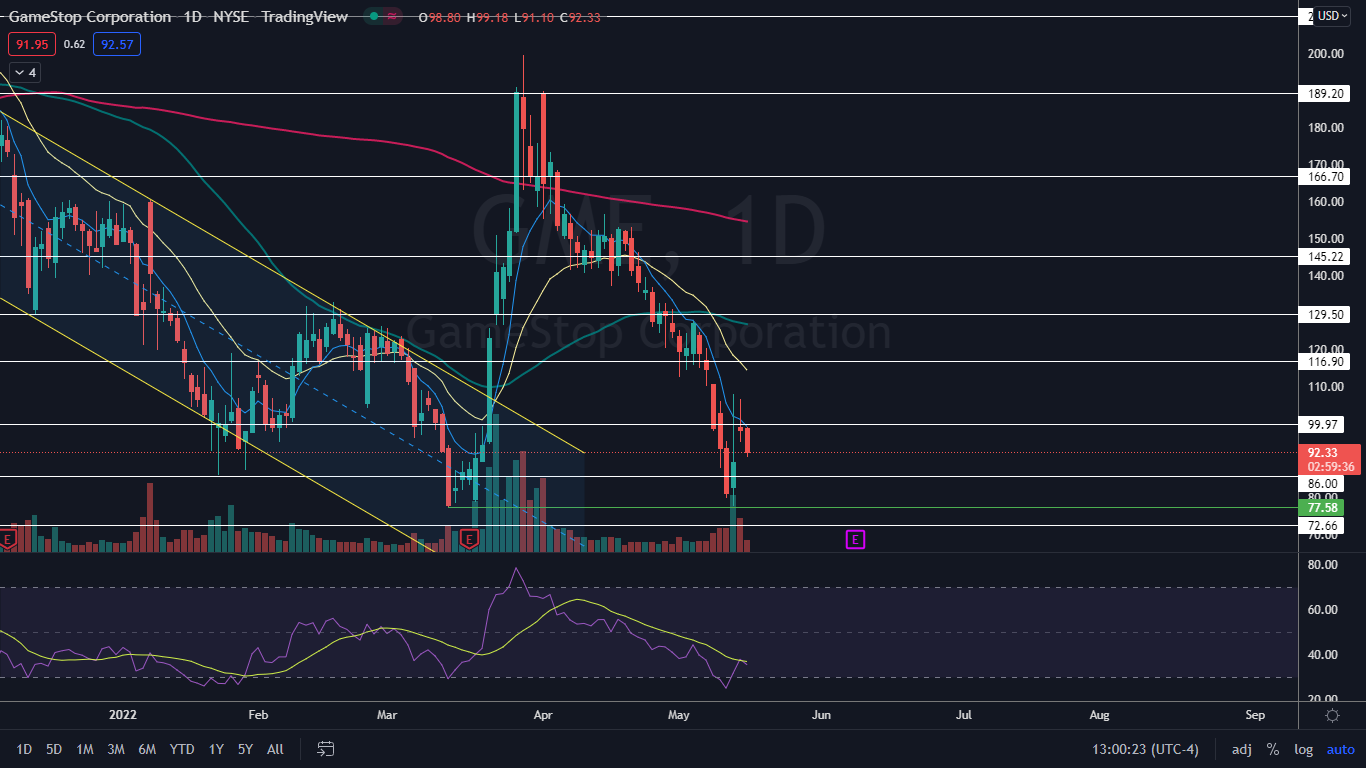
The GameStop Chart: GameStop’s most recent lower high was printed on May 12 at $108.06 and the most recent confirmed lower low was formed at the $77.58 mark on that same day. On Monday, GameStop was trading down but attempting to bounce up from the low-of-day, which could indicate a trend change is in the cards.
- Monday’s price action was taking place on lower-than-average volume, which indicates GameStop may be in a period of consolidation. At press time, only about 1.94 million GameStop shares had exchanged hands compared to the 10-day average of 3.72 million.
- If GameStop closes the trading day near its low-of-day price, the stock will print a bearish Marubozu candlestick, which could indicate lower prices will come again on Tuesday. If the stock is able to bounce up to close the session with a lower wick, it will form a hammer candlestick, which could indicate higher prices will come on Tuesday and the downtrend will be negated with a higher low.
- GameStop has resistance above at $99.97 and $116.90 and support below at $86 and $72.66.
© 2024 Benzinga.com. Benzinga does not provide investment advice. All rights reserved.
Comments
Trade confidently with insights and alerts from analyst ratings, free reports and breaking news that affects the stocks you care about.

