


Ford Motor Co F was trading about 3% higher Tuesday, inversely to the general market, after the automaker’s CEO Jim Farley announced the new Ford F-150 model will be revealed at 8 p.m. ET on Tuesday in downtown Detroit.
The move caused Ford to form a higher high, indicating its recent uptrend remains intact. An uptrend occurs when a stock consistently makes a series of higher highs and higher lows on the chart.
The higher highs indicate the bulls are in control, while the intermittent higher lows indicate consolidation periods.
Traders can use moving averages to help identify an uptrend, with rising lower time frame moving averages (such as the eight-day or 21-day exponential moving averages) indicating the stock is in a steep shorter-term uptrend.
Rising longer-term moving averages (such as the 200-day simple moving average) indicate a long-term uptrend.
Want direct analysis? Find me in the BZ Pro lounge! Click here for a free trial.
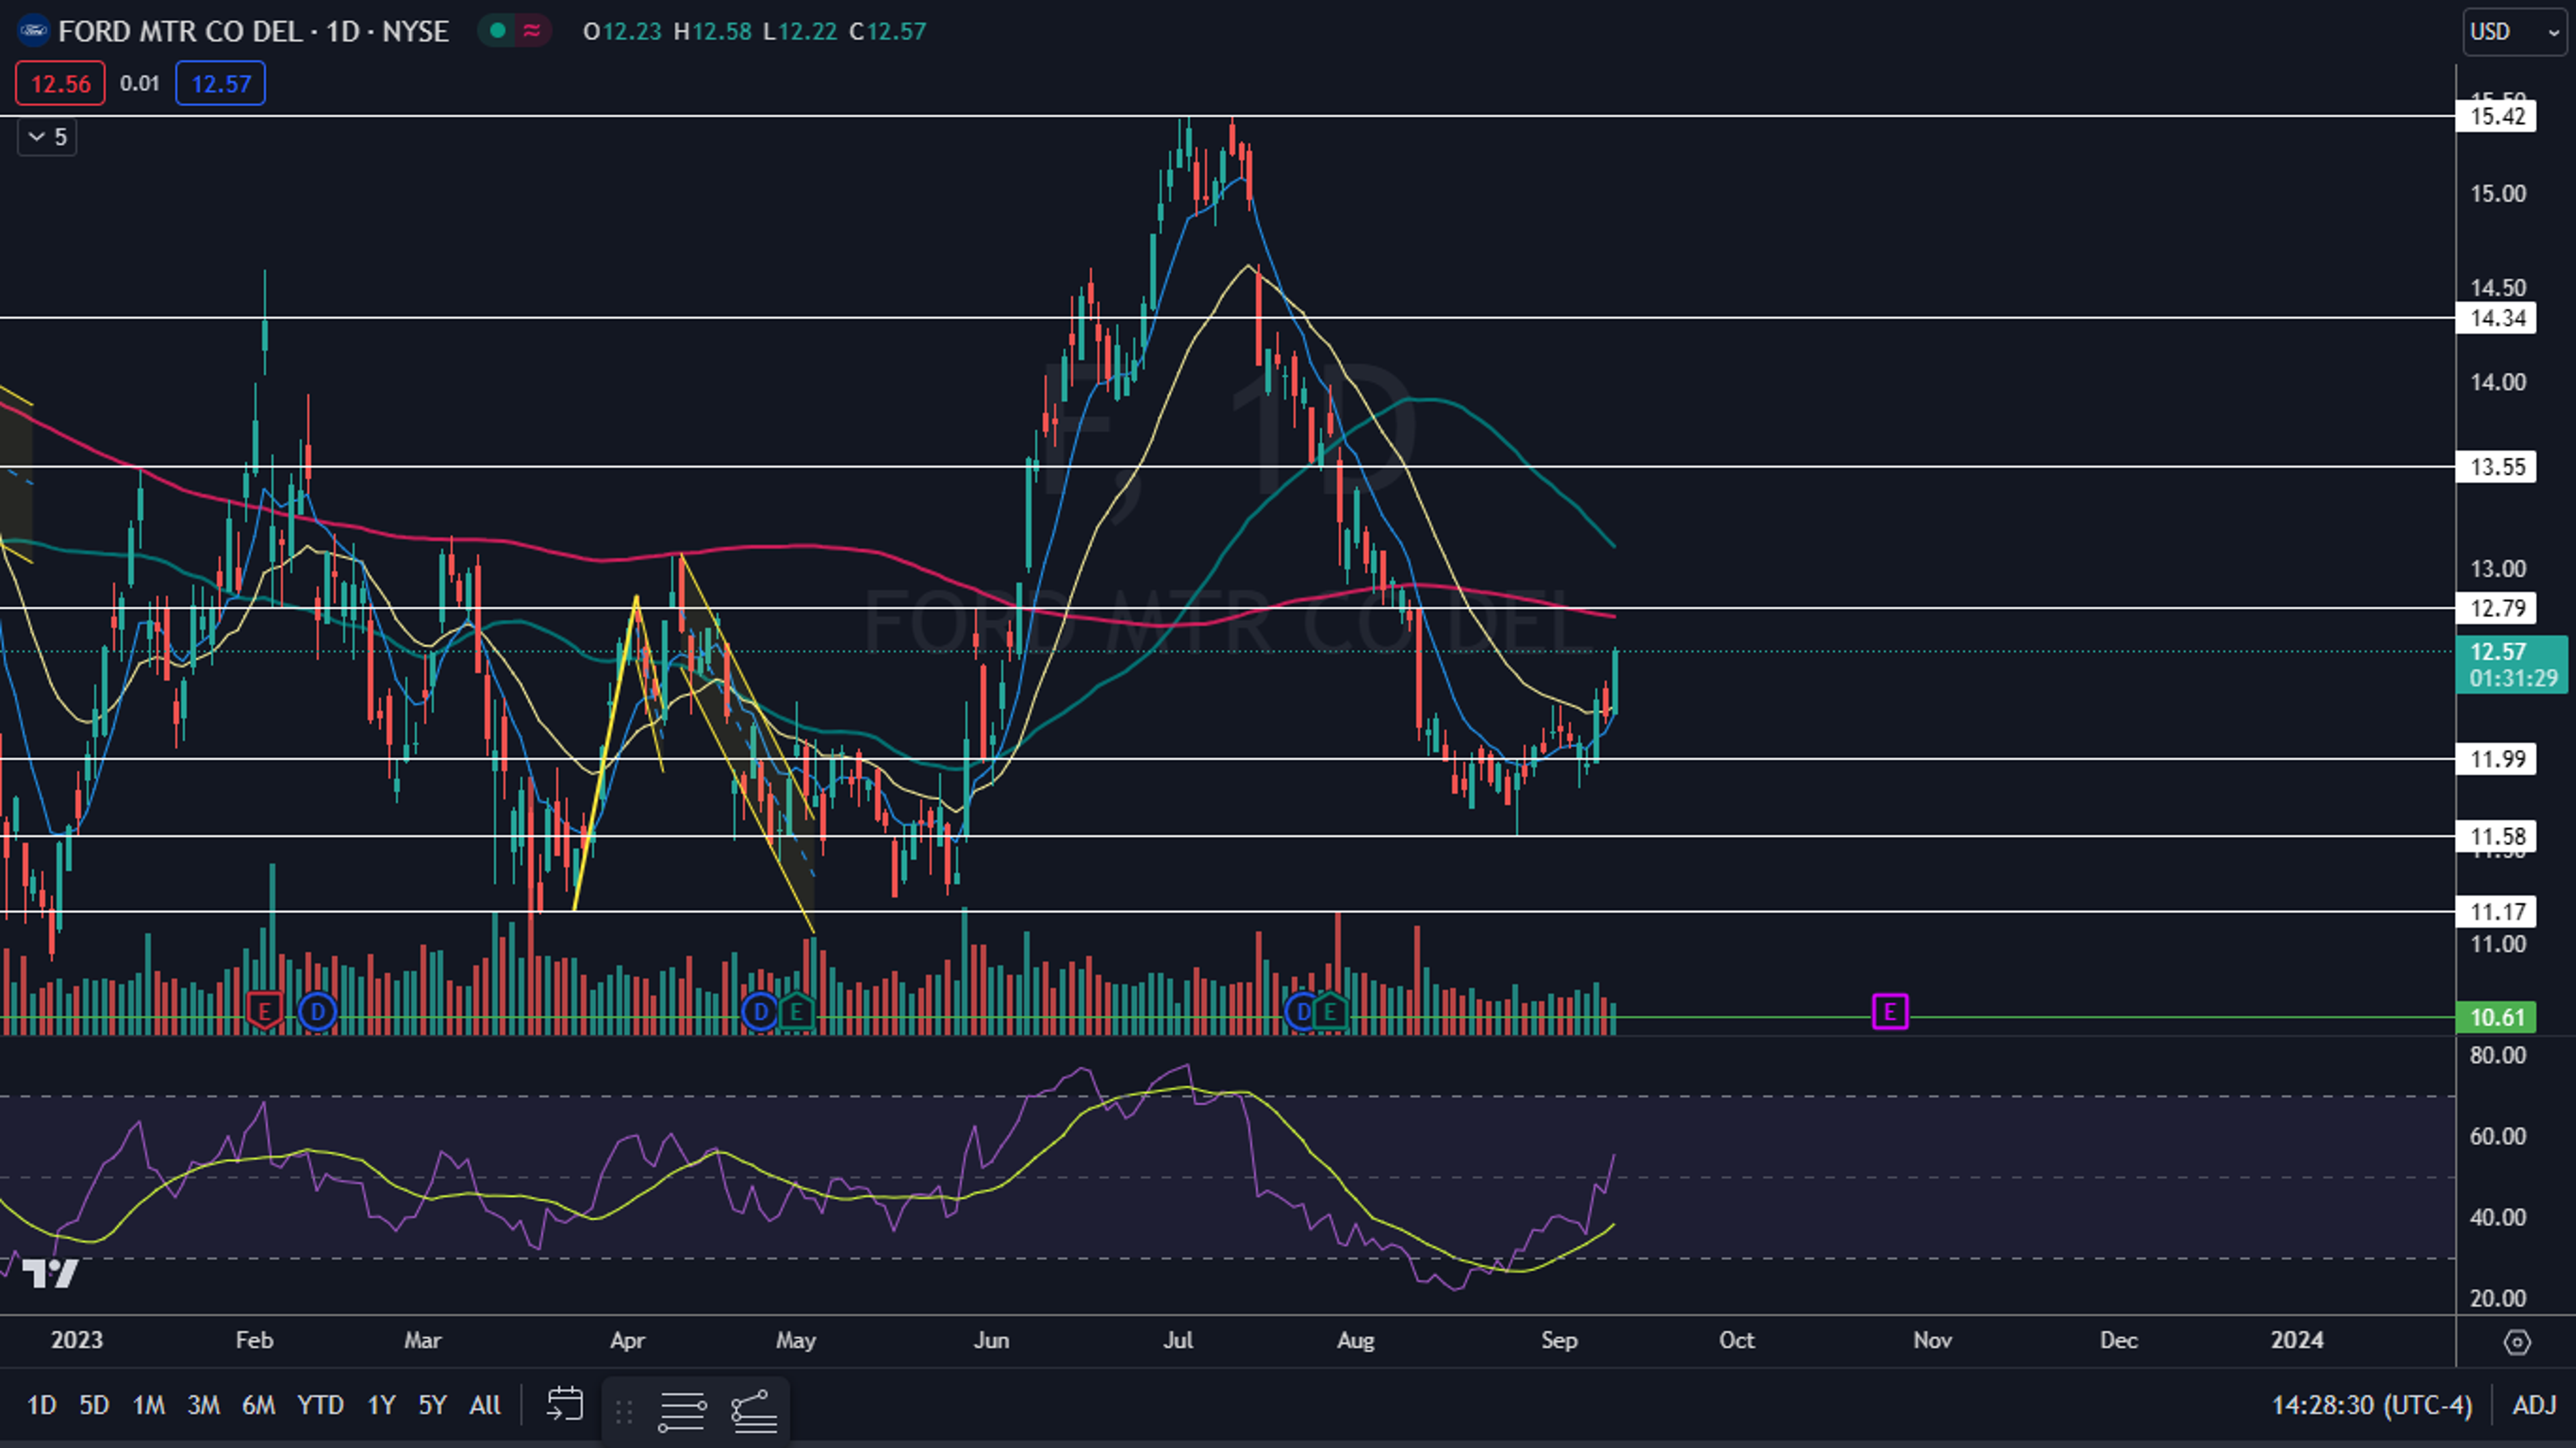
The Ford Chart: Ford reversed course into an uptrend on Aug. 25 and has since made a consistent series of higher highs and higher lows. The stock’s most recent higher low was formed on Sept. 6 at $11.83 and the most recent confirmed higher high was printed at the $12.27 mark on Sept. 1.
- On Tuesday, Ford was moving up toward the 200-day simple moving average (SMA) on the daily chart. If Ford closes the trading session near its high-of-day, the stock will print a bullish Marubozu candlestick, which suggests higher prices may come on Wednesday.
- The second most likely scenario is that Ford trades sideways on Wednesday, forming an inside bar pattern on the daily chart, which would lean bullish for a continuation. If the stock continues to trade higher, it’s likely to find at least temporary resistance at the 200-day SMA.
- If Ford regains the 200-day SMA over the next few trading days, the 50-day SMA will remain above the 200-day SMA, which will avoid a death cross forming.
- Ford has resistance above at $12.79 and at $13.55 and support below at $11.99 and at $11.58.

Read Next: Stock Market Slips Ahead Of Key Inflation Data, Fed Decision On Rates: The Bull, Bear Case
Photo: Ford
© 2024 Benzinga.com. Benzinga does not provide investment advice. All rights reserved.
Trade confidently with insights and alerts from analyst ratings, free reports and breaking news that affects the stocks you care about.

