


Amazon.com, Inc AMZN gapped lower to start Thursday’s trading session before popping up above Wednesday's high-of-day after the CEO of Worldwide Amazon Stores, Doug Herrington, sold a total of 4,000 shares of the company.
The e-commerce and streaming giant’s move higher helped to pull the S&P 500 up slightly from its low-of-day despite Apple dragging the index down to start the session.
From a technical analysis perspective, Amazon bounced up from the lower ascending trend line of a symmetrical triangle pattern, indicating the formation is being recognized by algorithms.
A symmetrical triangle pattern is created when a stock forms a series of lower highs and higher lows between a descending and an ascending trendline, which meet on the right side of the chart to form an apex. The pattern indicates that the bulls and bears are equally in control.
A symmetrical triangle is often formed on lower-than-average volume and demonstrates a decrease in volatility, indicating consolidation. The decreasing volume is often followed by a sharp increase in volume when the stock breaks up or down from the pattern, which should happen before the stock reaches the apex of the triangle.
Want direct analysis? Find me in the BZ Pro lounge! Click here for a free trial.
The Amazon Chart: Amazon started to trade in a symmetrical triangle Aug. 3 and has been making a fairly consistent series of lower highs and higher lows. The most recent lower high was formed on Sept. 1 at $139.96 and the most recent higher low was printed at the $133.16 mark on Thursday.
- Bullish traders want to see the stock eventually break up from the upper descending trend line of the triangle, which could cause the stock to enter into a longer-term uptrend. Bearish traders want to see Amazon break down from the pattern, which could accelerate downside pressure.
- A move to the upside is slightly more likely if Amazon can continue to trade above the 50-day simple moving average (SMA) on the daily chart. On Thursday, the stock tested the 50-day SMA as support and bounced up from that area.
- Amazon has resistance above at $136.83 and at $142.18 and support below at $131 and at $125.93.

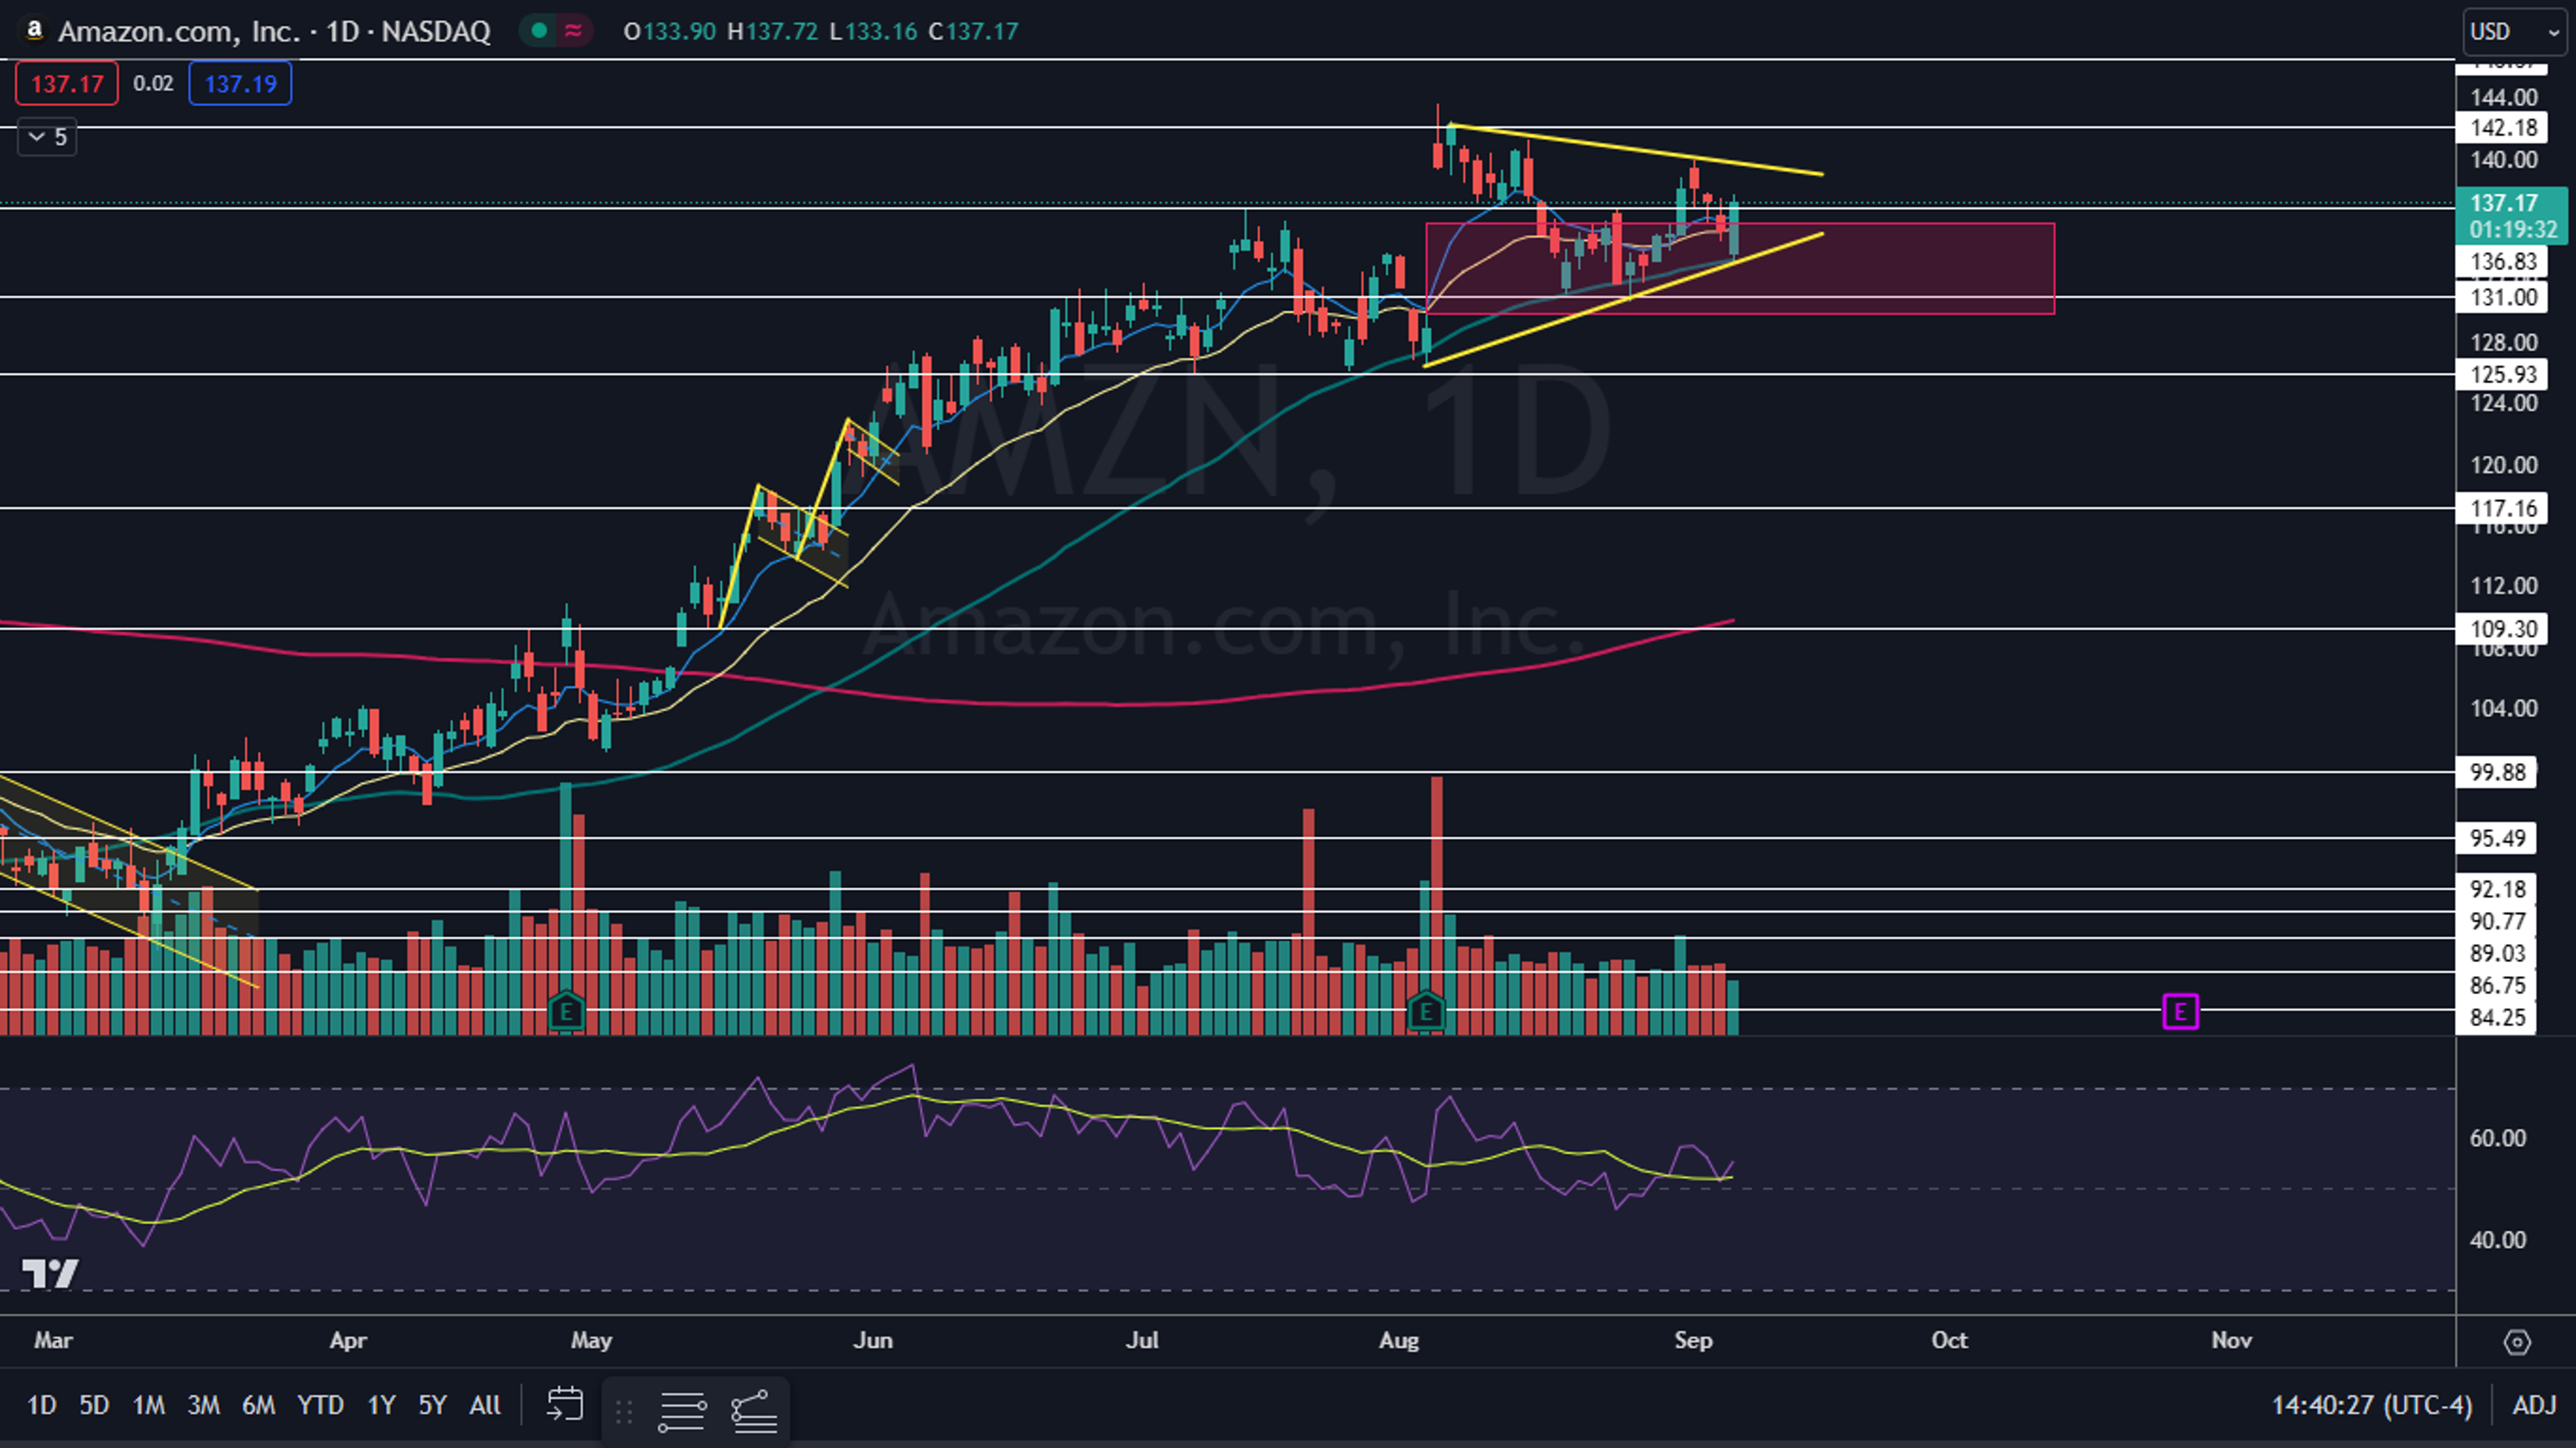
Photo via Shutterstock.
© 2024 Benzinga.com. Benzinga does not provide investment advice. All rights reserved.
Trade confidently with insights and alerts from analyst ratings, free reports and breaking news that affects the stocks you care about.

