


GameStop Corporation GME swung wildly Thursday after printing better-than-expected second-quarter earnings.
For the quarter, GameStop reported a loss of 3 cents per share on revenues of $1.16 billion, exceeding the consensus estimate of a loss of 14 cents per share on revenues of $1.14 billion.
Following the print, Wedbush analyst Michael Pachter on Thursday maintained an Underperform rating on the stock and lowered a price target from $6.20 to $6. The new price target suggests about 67% downside for GameStop.
GameStop’s price action on Thursday caused both a bullish and a bearish pattern to print on the stock’s chart because when GameStop rose to its high-of-day it formed a bearish double top pattern, but when the stock bounced up from the low-of-day it formed a bullish higher low and was looking to print a hammer candlestick.
Want direct analysis? Find me in the BZ Pro lounge! Click here for a free trial.
The GameStop Chart: GameStop negated a downtrend on Aug. 31 by printing a higher high at the $19.42 level, which was above the most recent lower high formed at the $18.82 mark on Aug. 21. On Thursday, the stock was working to print a higher low, which may confirm a new uptrend if GameStop bounces higher on Friday.
- Bearish traders want to see the double top pattern play out, which was printed near the $19.40 mark on Aug. 31 and on Thursday. If the bearish pattern is recognized, GameStop may fall lower on Friday to print a possible lower low, which would indicate Thursday’s bounce up from the low-of-day was a bull trap.
- Bearish price action for the stock is slightly more likely because on Aug. 30, a death cross formed on GameStop’s chart. A death cross occurs when the 50-day simple moving average (SMA) crosses under the 200-day SMA.
- Another likely scenario is that GameStop may trade sideways for a period of time, possibly forming a series of inside bars on decreasing volume. If that happens, traders can watch for an eventual break up or down from Thursday’s mother bar on higher-than-average volume to gauge the future direction.
- GameStop has resistance above at $20.10 and at $21.97 and support below at $17.95 and at $15.41.

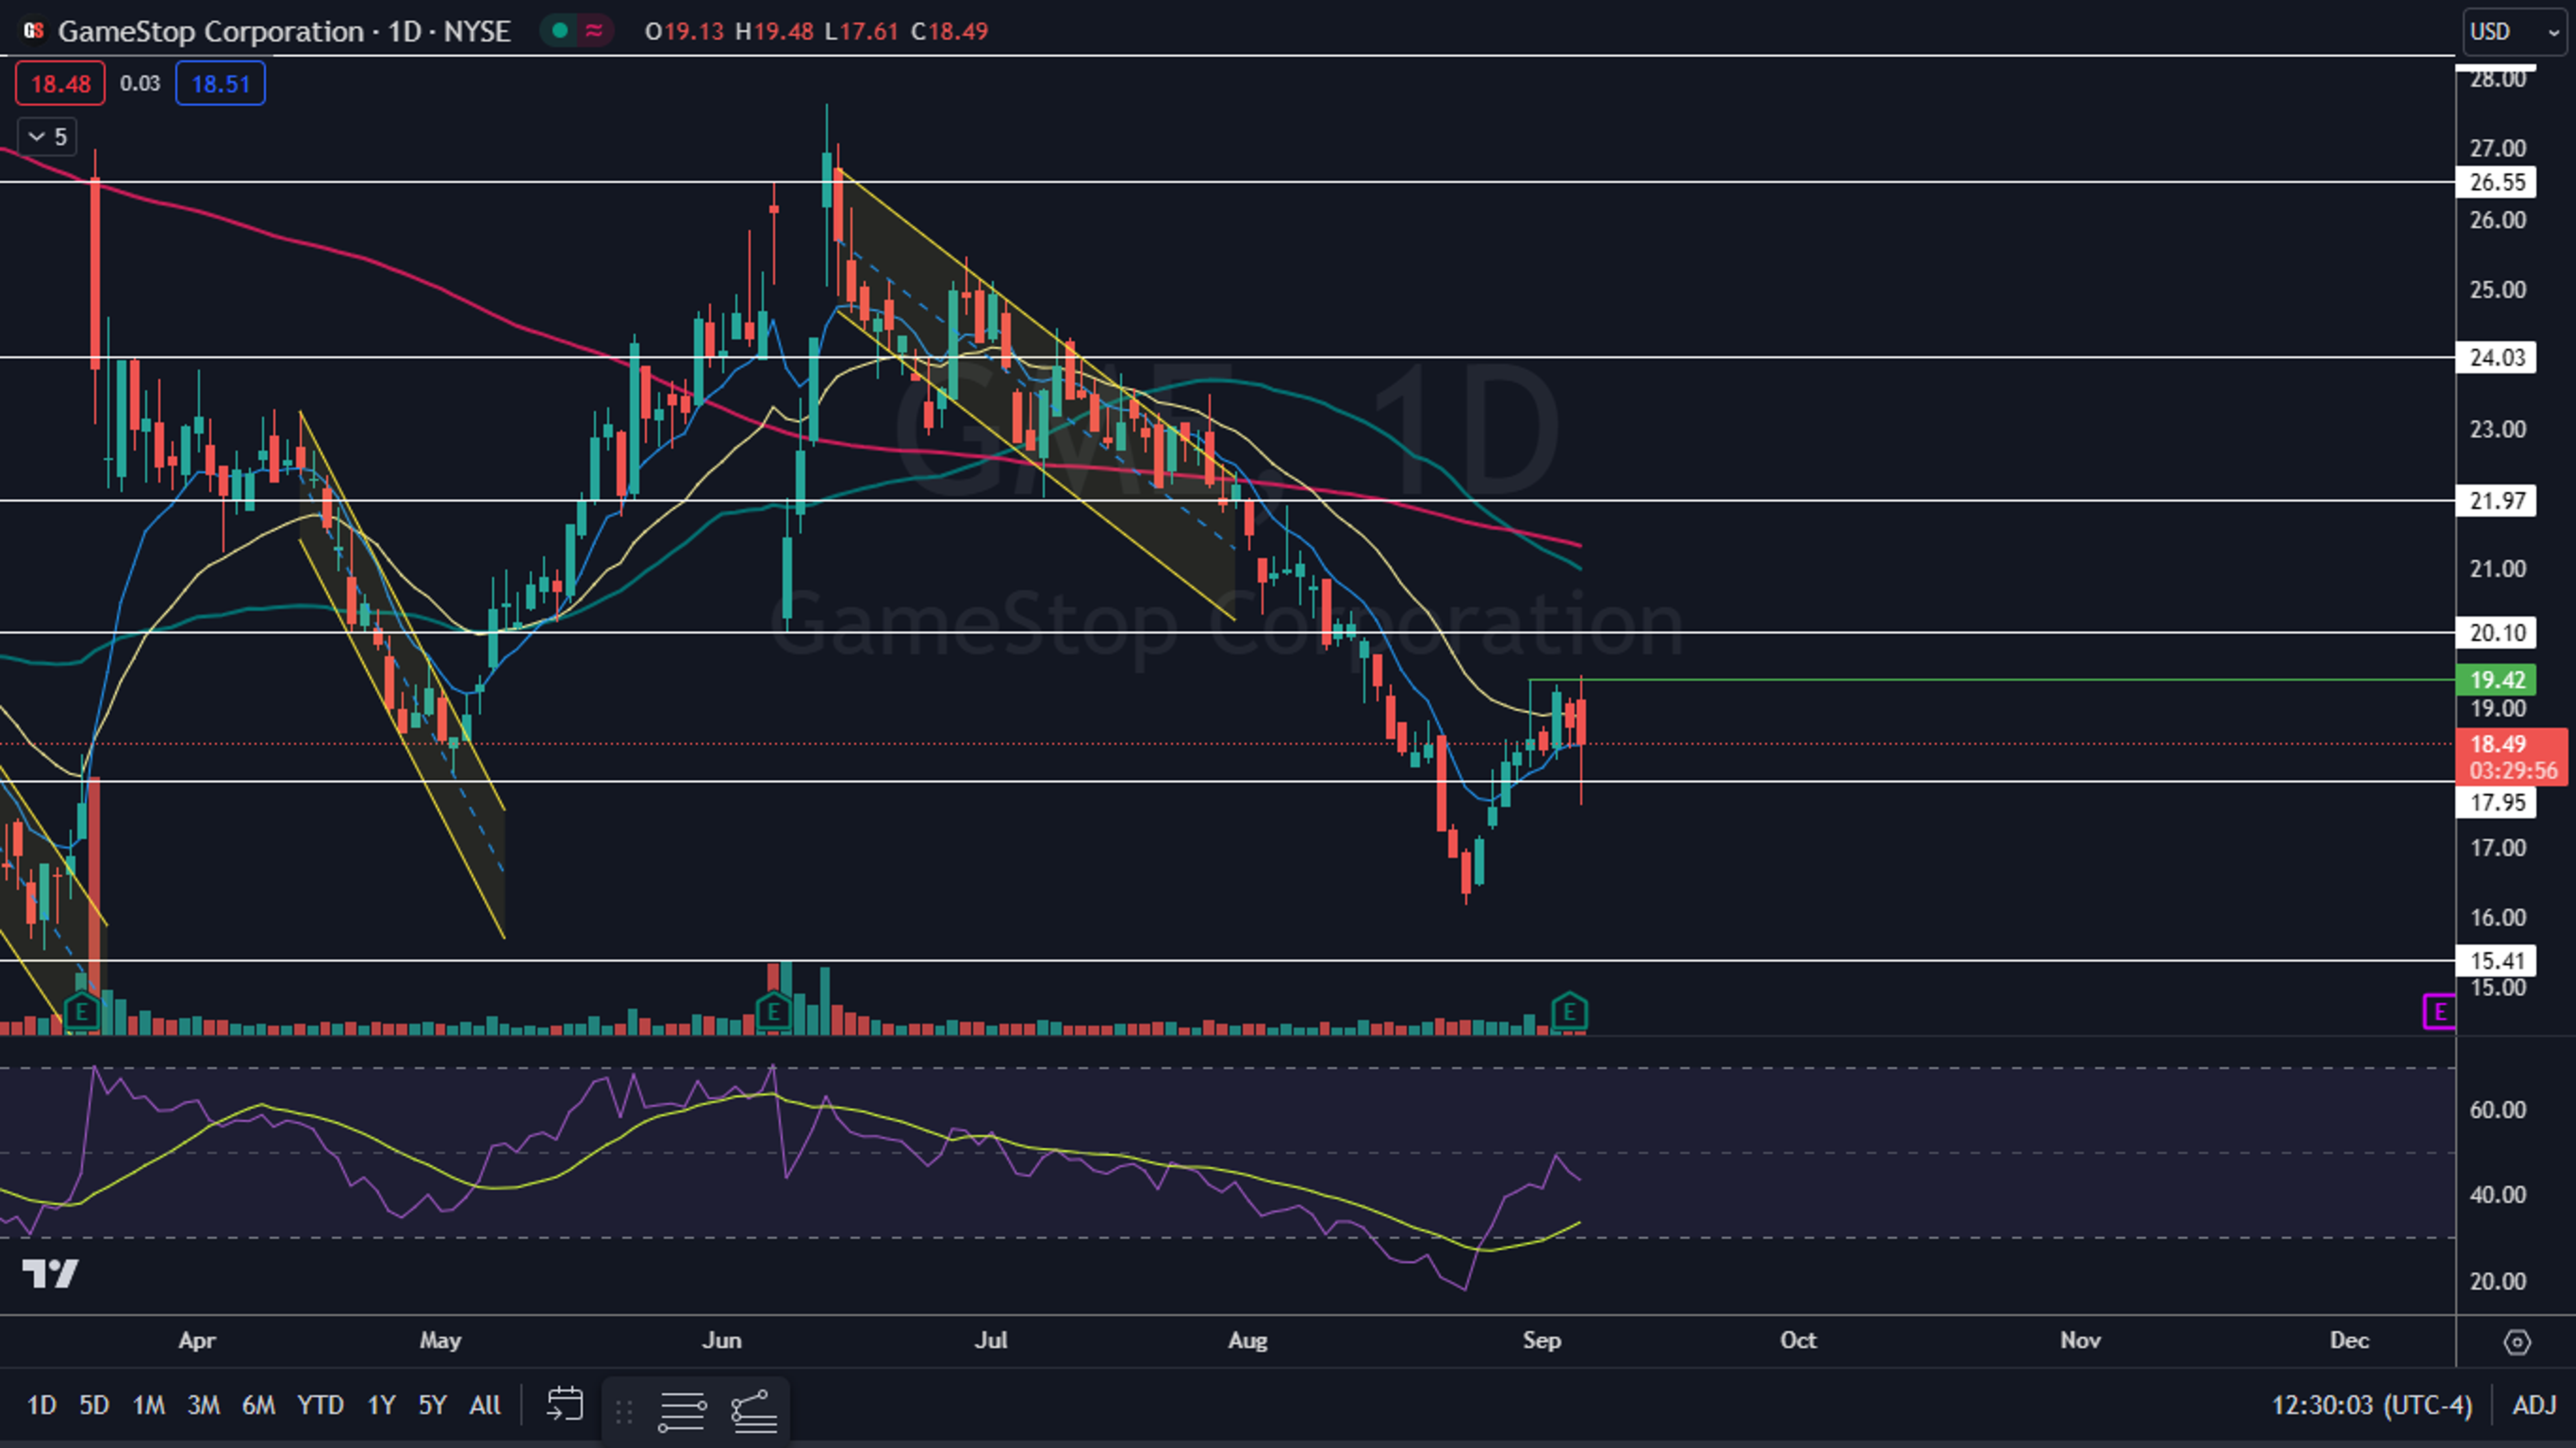
Image: Shutterstock
© 2024 Benzinga.com. Benzinga does not provide investment advice. All rights reserved.
Trade confidently with insights and alerts from analyst ratings, free reports and breaking news that affects the stocks you care about.

